The vapour-compression cycle at the heart of most air-conditioning systems consists of a closed loop of volatile fluid. In the diagram below the fluid in vapour form at (1) is compressed, which raises its temperature (2), after which it passes through a heat exchanger (the “condenser”) where it is cooled by water or ambient air. At (3) it reaches its dewpoint temperature and condenses, changing back to liquid (4). The liquid passes through an expansion valve. The abrupt drop in pressure causes a drop of temperature as some of the fluid turns to vapour: the resulting cold liquid/vapour mixture passes through a heat exchanger (the “evaporator”) picking up heat from the space and turning back to vapour (1).
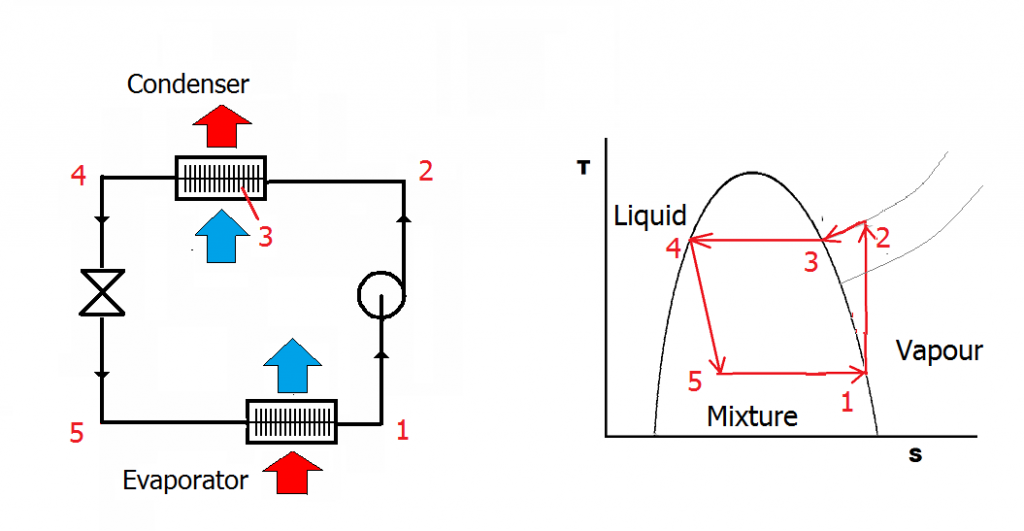
The condenser has two jobs to do. It needs to dump latent heat (3->4) but first it must dump sensible heat just to reduce the vapour’s temperature to its dewpoint. This is referred to as removing superheat.
It has been claimed that it is possible to improve the efficiency of this process by injecting heat between the compressor and condenser (for example by using a solar panel). Could this work?
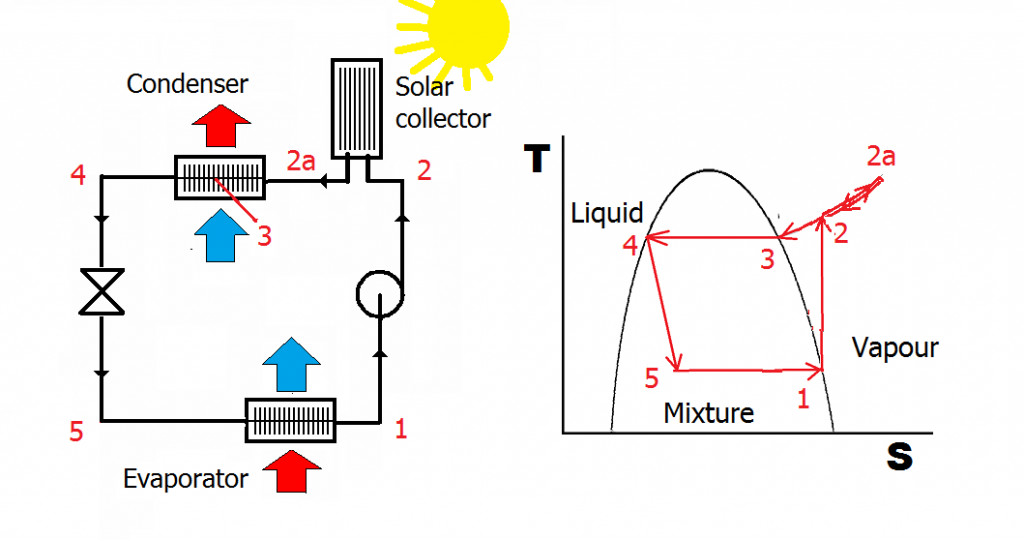
The claim is based on the idea that injecting heat reduces the power drawn by the compressor. It is an interesting claim because it contains a grain of truth, but there is a catch: the drop in power would be inextricably linked to a drop in the cooling capacity of the apparatus. This is because we have now superheated the vapour even more than before, so the condenser now needs to dump more sensible heat. This reduces its capacity to dump latent heat. The evaporator can only absorb as much latent heat as the condenser can reject: if the latter is reduced, so is the former. Any observed reduction in compressor power is the consequence of the cooling capacity being constrained.
The final nail in the coffin of this idea is that reduced power is not the same as reduced energy consumption: the compressor will need to run for longer to pump out the same amount of heat. Thus there is no kWh saving, whatever the testimonials may say.
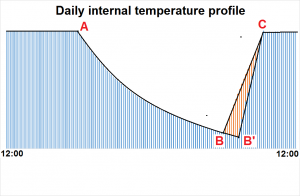 likely to be? The picture on the right shows a simulation of the diurnal temperature variation, mid-day to mid-day, in an intermittently-heated space.