Category Archives: Uncategorized

Business opportunity in energy training

Now that I’ve given up providing training courses and organising other events related to energy management, there could be an opportunity for another consultancy to take up the slack as a commercial venture. Happy to provide advice to anyone that’s interested.

Incidentally for anyone who is considering it I have a good web domain for sale: energy.training.

Please contact me by email for further details.

Vehicle fuel performance

Getting the record straight

One of the frustrations of doing road-transport energy audits is the inadequacy of the data that vehicle operators record. Unless they can download consumption and distance data from the vehicle itself, they are unlikely to have much more than fuel-purchase data complemented by unusable mileage readings (the term ‘mileage’ here includes odometer readings in kilometres).

Unusable mileage figures are a major problem. For example, fuel bought on fuel cards should be accompanied by mileage records, but everyone knows that these are usually missing or incorrect. Some organisations make efforts to collect the right data but fall short: among my recent clients Company ‘S’ for example had a rigorous process for recording the daily start and finish mileages for their HGVs, along with fuel purchased during the shift, but that left huge uncertainty because a vehicle could have been refuelled at any point in a shift which could have covered hundreds of miles. And even if the mileage had been recorded at each refuelling, the driver would need to  consistently brim the tank on each occasion to make the record accurate. As a result, their MPG reports were wildly erratic. In Figure 1 I compare a typical vehicle from Company S’s fleet (left) with one from Company H which collects data from its vehicles’ onboard systems:

Figure 1: weekly fuel versus distance for freight vehicles. Left: based on daily fuelling and end-of-shift mileages; right: derived from onboard consumption and distance records

Company S (on the left) can probably get a reasonable estimate of annual MPG for each vehicle but not much more. Company H, on the other hand, can detect deviations from expected fuel economy on a weekly basis and intervene promptly wherever it has deviated significantly.  For sustained deviations they can also discern the nature of the change and discriminate between fixed and mileage-related excess consumption.

For vehicles where telemetry data are not available, the user needs to adopt a recording protocol that will yield accurate consumption and distance data at regular intervals. Of course this is not as straighforward as it might be for metered consumptions, because you cannot get a fuel ‘reading’ at the end of each period (week or month). The trick I have settled on is this: the data points for each period consist of (a) the sum of all fuel taken during the period and (b) the mileage between the last fill of the period and the last fill of the previous period.

Figure 2 illustrates a spreadsheet in which this is method is used for a monthly review.

Figure 2

Note it is crucially important that drivers consistently fill their tanks to the brim. Actual refuelling data go in Table A, columns B, C and D, while the regularised monthly litres and mileage are calculated in Table B. What links the tables is a column of ‘Period numbers’. They are defined in Column G as simply the sequential row number of the table, and in column A they are calculated by looking up the Table A date in column B. Thus by way of an example the Table-A entries for 03/08/23 and 14/08/23 belong to period 10 .

Meanwhile in Table B…

  • the logic for calculating the incremental distance just looks up, in Table A, the finish mileages for the current and previous periods based on the period-end dates (and takes the difference); while
  • the litres value uses a SUMIF() function to summate all the values in Column D that have the matching period-number in Column A.

There is a copy of the example worksheet here for anyone who wants it as a starting point for their own projects. It can be made to work on a weekly cycle simply by setting the period ends in Column F at seven-day intervals.

Finally Figure 3  shows analysis of monthly fuel consumption for the passenger car whose data appeared in the example above:

Figure 3: the data used in the example

Despite the random refuelling pattern, the correlation is reasonable and in fact would have been better were it not for the fact that performance was worse prior to July 2023 and from January to April 2024.

Thanks are due…

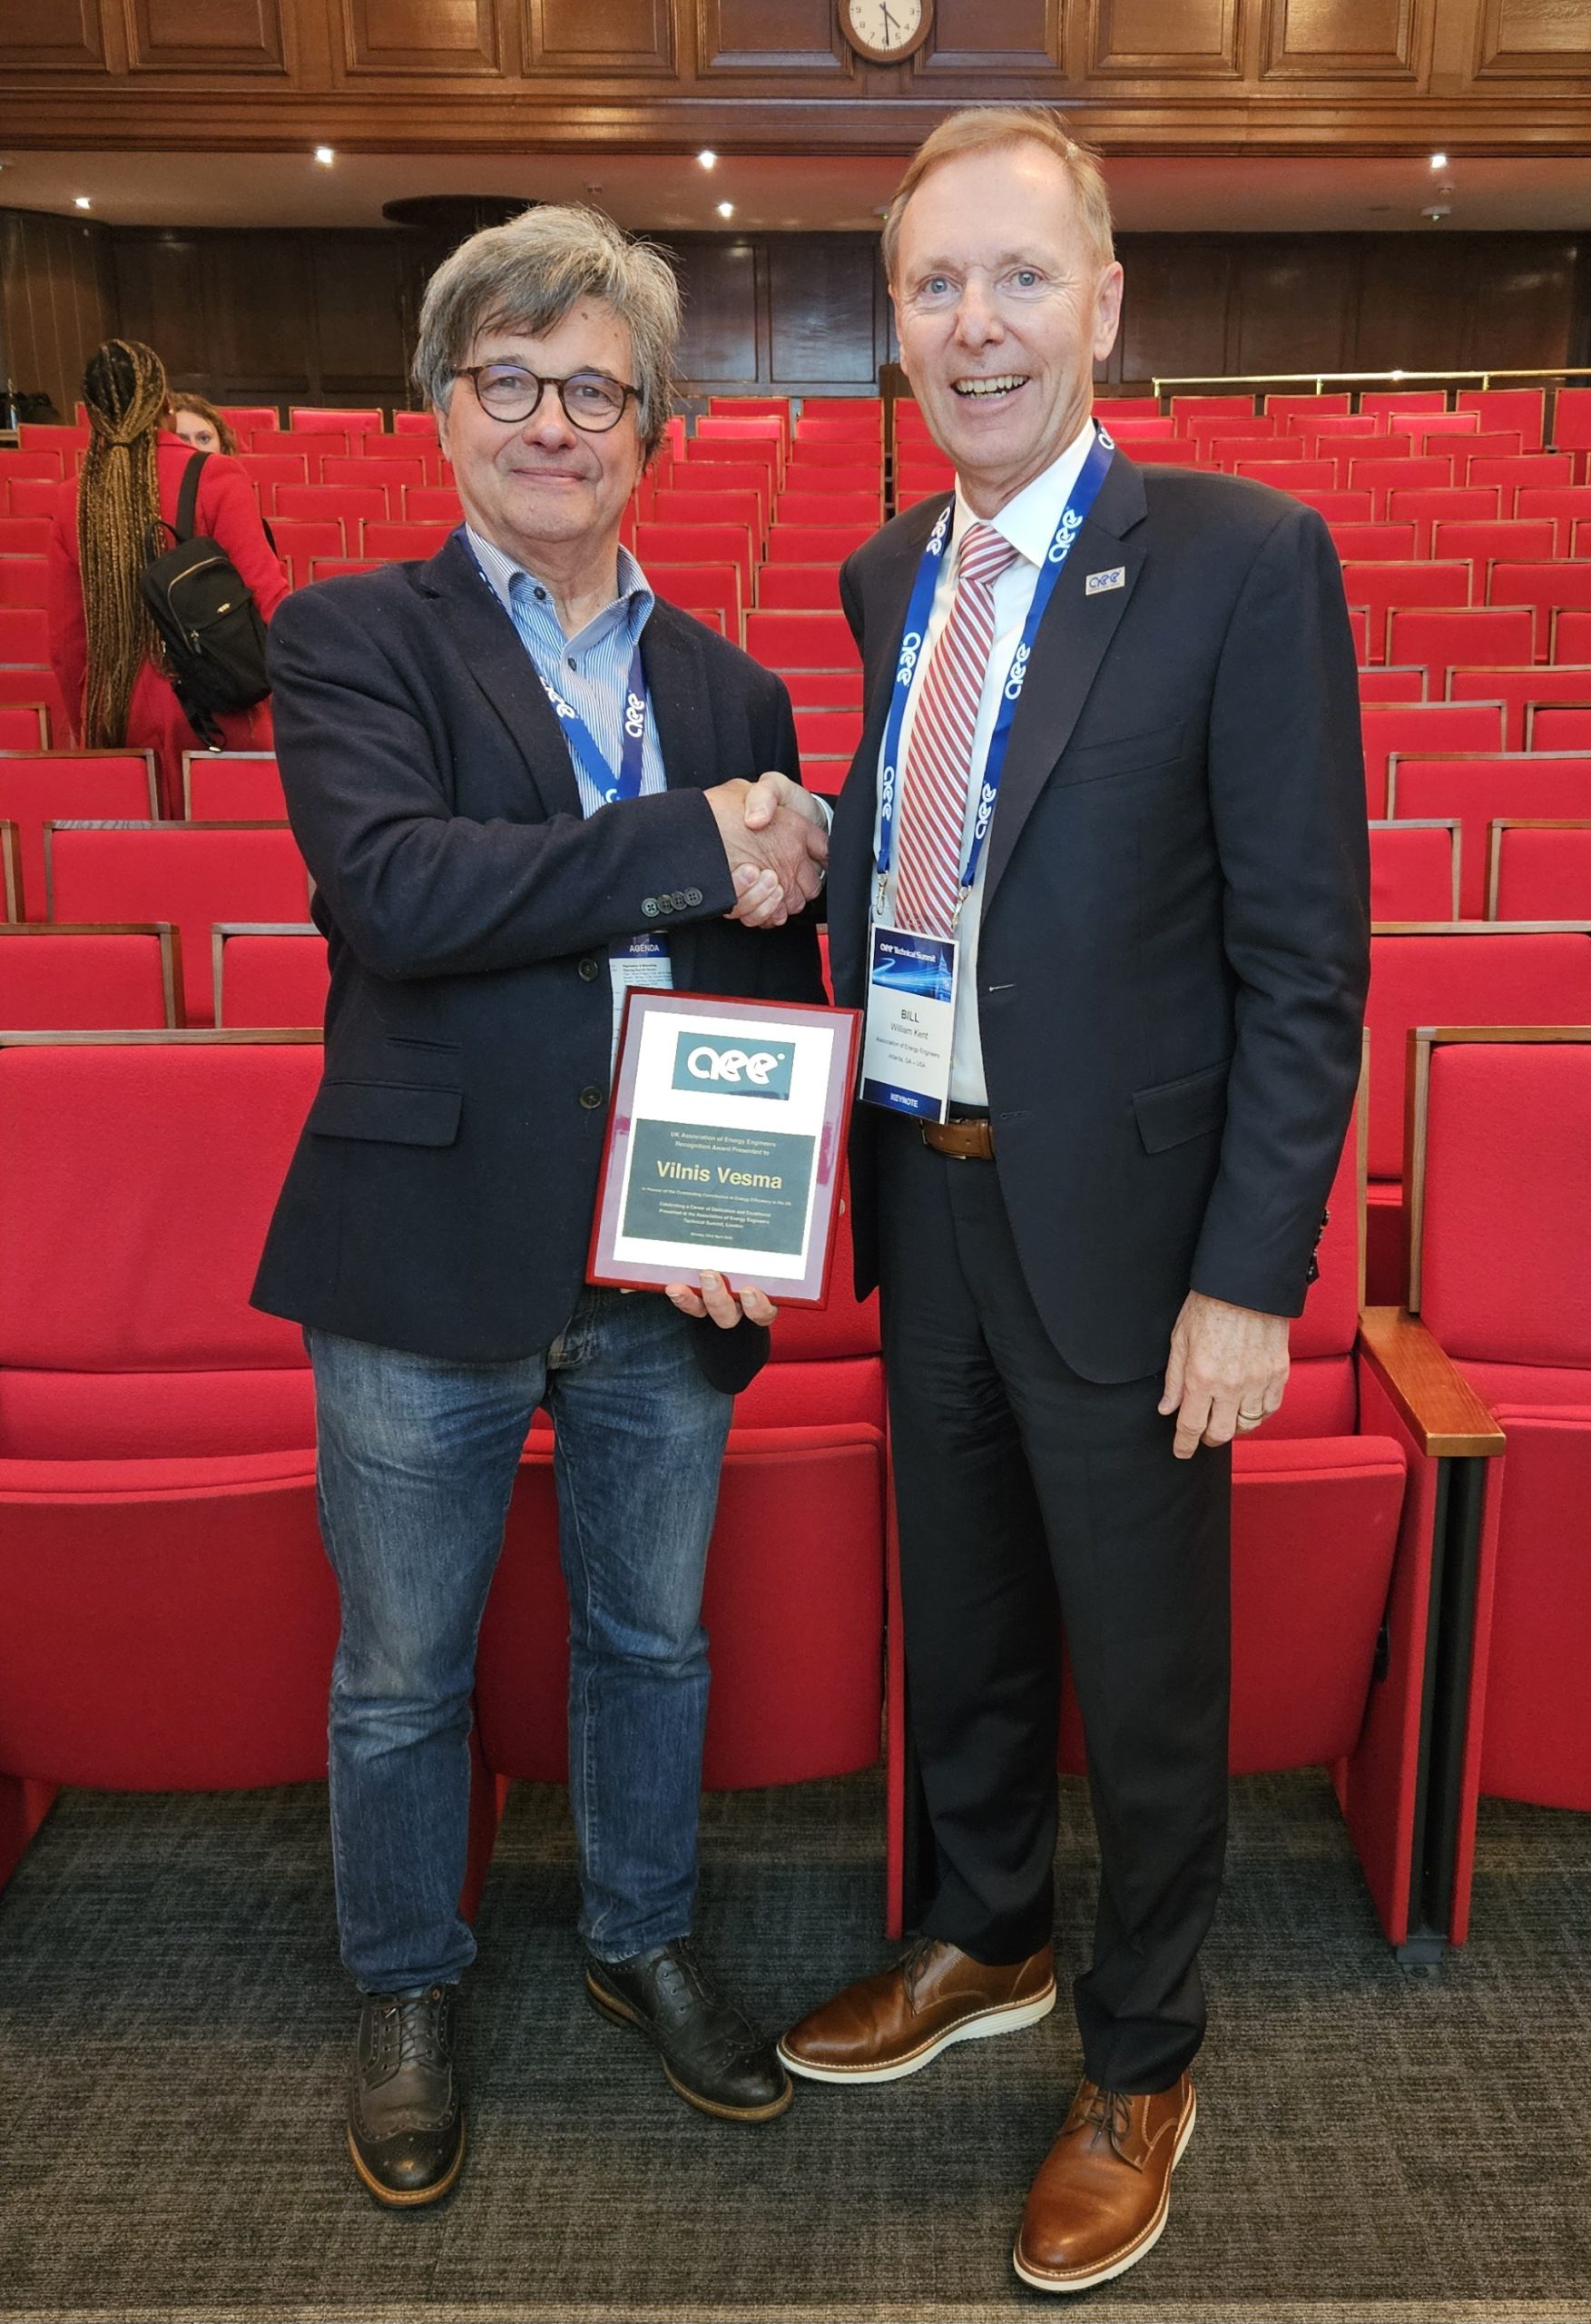
With Bill Kent of the Association of Energy Engineers after being presented with their Lifetime Achievement Award. In my acceptance speech I acknowledged just a few of the many people to whom I owe a debt of gratitude for the advice and inspiration they have given me over the years.

I’d start with Mike Horsley, a lecturer at Portsmouth Polytechnic (as it then was) and chairman of one of committees which I was responsible for servicing during my time as education officer and deputy secretary at the Institute of Energy (as it then was) in 1979-81. Mike encouraged me to render myself unemployed so that I could enrol on his 5-month full-time energy supervisors’ course, which in turn opened the door to my first job as an energy manager at Lambeth Council.

Colin Ashford was my opposite number at Hackney Borough Council and an enthusiast for personal computers, which in those days were almost unknown in the workplace. Colin invited me over to see how desktop computers could be applied to energy management, and convinced me to get one at Lambeth (where I think for a while I may have been the only person using one).

From there I moved across to Gloucestershire County Council to work with Mike Simpson, a highly experienced and competent energy manager who helped me enormously in developing my craft, and John Willoughby, our colleague who was energy manager for the local technical college campuses. John was not only an expert in energy saving in buildings (and incidentally the founding editor of Energy in Buildings magazine) but also a former lecturer who got me interested in training. It was John’s example that led to my use of models and physical aids on training courses.

While I was at Gloucestershire I had a phone call from Andrew Buckley, in more recent times director of the Major Energy Users’ Council but in those days the owner of a publishing and training business specialising in energy subjects. I’d originally encountered Andrew in my Institute of Energy days when his company had published the Directory of Qualified Energy Consultants which I had developed as an in-house reference document. Now, however, he became animated when I said I was applying desktop computers to energy management. He asked if I could do a book on the subject (which I did) and run some training courses for him… Which I did, after resigning from my job and going to my bank for a loan (£15,000 in today’s money) to buy ten computers.

Andrew had meanwhile introduced me to his colleague Dr Peter Harris who was presenting training courses on energy monitoring and targeting. It was Peter who introduced me to degree-days and cusum analysis, which completely transformed the way I went about analysing and managing energy, and became the foundation of what I subsequently did as a self-employed energy consultant. Combining the analysis techniques with the newly-emerging personal computer got me into selling energy monitoring and targeting software and providing expert advice in that domain.

For a while in the mid-1990s my brother-in-law Joe O’Keefe worked with me as a (somewhat older than average) intern because he wanted a radical change of career path. Not having much to employ him on, I gave him free rein to tinker with computers and it’s thanks to Joe that the vesma.com website appeared in 1996… The perfect gift for an ardent self-publicist like me.

Sadly some mis-steps ensued and just short of my tenth anniversary as a self-employed consultant I came close to going bust. Luckily I was rescued by Roger Hawes who was running the energy team at Torpy and Partners in Bristol and took me on when I asked for a job, something I will always be grateful for. Likewise John Mulholland who persuaded NIFES to take me on after Torpy’s became part of the Enron empire (I bailed out because I thought Enron’s European business was doomed to fail; I did not suspect the true scale of the looming disaster). John ran NIFES’s training division and was another person who helped me hone my training skills. He looked after his team exceptionally well and I remember he always had my back with the directors when I overstepped the mark.

In due course, and prompted by the financial crash of 2008/9, I left John’s team to strike out on my own once more; and while looking for collaborators and associates I renewed my acquaintance with Andrew West, who lives a few miles away and had helped me with monitoring and targeting projects in the 1990s. In the intervening years Andy had changed his career path radically and become a book-keeper. To cut a long story short he agreed to come on board and take care of not just book-keeping but other administrative tasks. It’s fair to say the business was never more successful than when Andy was there to deal with back-office distractions.

The provision of free degree-day statistics has been a cornerstone  of my marketing for 35 years so it would be churlish not to acknowledge the help I got from The Thatcher Government in 1991 when they discontinued the supply of official degree-day data. It created a vacuum that I was able to fill with prominent monthly exposure in the print media, and ultimately even became a source of revenue when they were shamed into reinstating it and found that they weren’t allowed to accept a single tender from the Met.Office. But that’s a different story.

The full list of those who’ve helped me along the way would be long and in some cases complicated to explain. So with apologies to those that I haven’t mentioned I would just like to thank my loyal clients over the years and all the bulletin readers who sent in the awkward technical questions on which subsequent issues were based.


Net and gross calorific values

In the UK when estimating fleet energy consumption from vehicle mileages,  we may choose to use the tables published in official guidance (extract illustrated below) which convert distances in miles or kilometres to kWh consumptions for different classes of vehicle.

Figure 1: extract from the tables in UK Government guidance

As indicated in Figure 1, the conversion factors are stated on a net calorific value (NCV) basis. However, this is not compatible with the way we normally account for energy in the UK. We actually use gross calorific values (natural gas, which of course is our predominant fuel for static applications, is billed on a GCV basis). For consistency we should account for transport fuels on a GCV basis as well.

What difference does it make? A fuel’s gross calorific value is a measure of its total energy content, whereas NCV ignores that fraction of energy which will be lost as latent heat in water vapour in the exhaust. The higher the hydrogen content of a fuel, the greater the discrepancy. Forecourt diesel’s GCV is 6.3% higher than its NCV; for natural gas the difference is 10.8%.

To convert kWh quantities based on NCV to their GCV equivalent you need to multiply by the following factors:

Aviation Spirit 1.053
Aviation Turbine Fuel 1.053
Burning Oil 1.053
Butane 1.084
Coal (domestic) 1.053
Coal (electricity generation) 1.053
Coal (electricity generation – home produced coal only) 1.053
Coal (industrial) 1.053
Coking Coal 1.053
Diesel (100% mineral diesel) 1.064
Diesel (average biofuel blend) 1.063
Fuel Oil 1.064
Gas Oil 1.064
Lubricants 1.064
LPG 1.074
Naphtha 1.053
Natural Gas 1.108
Natural Gas (100% mineral blend) 1.108
Other petroleum gas 1.087
Petroleum coke 1.053
Petrol (100% mineral petrol) 1.053
Petrol (average biofuel blend) 1.055
Propane 1.086
Waste oils 1.071


Keeping a sense of proportion

This web site doesn’t usually cover domestic energy saving but the topic is of indirect relevance when one is conducting staff energy awareness training. Learning about how to cut energy costs at home is one of the benefits to staff  of participating in such programmes.

At the time of writing (October 2022) UK energy prices are increasing dramatically and the media (as ever in such circumstances) are awash with energy-saving tips, many of which are trivial or patronising. As part of any awareness-raising programme it could be useful to steer people away from irrelevant time-wasting ideas and towards things that will actually make a difference. In this article I’ll put some numbers to some of the advice that’s currently doing the rounds. These are rough-and-ready estimates based on a lot of simplifying assumptions and the prices I will use are £0.15 per kWh for gas and £0.52 per kWh for electricity.

Tip no. 1: when cooking, avoid opening the oven door to inspect the contents

The argument presented here is that the hot air will escape and more energy will need to be put in to compensate. Let’s look at that: the capacity of the oven will be of the order of 60 litres. Let’s say all the air in the oven is replaced with room air. 60 litres of room-temperature air will have a mass of 0.07 kg. With a specific heat of near enough 1 kJ.kgK,  and supposing a temperature rise of (say) 180 degrees, that implies 0.07 x 1 x 180 = 12.6 kJ = 0.003 kWh, or 0.2 pence wasted. Verdict: bonkers.

To put that in perspective, it’s the equivalent of preheating the oven for 4 seconds longer than needed. But even preheating the oven prematurely isn’t a huge deal. Once up to temperature it will very likely dissipate something of the order of one kilowatt (costing 52p per hour) so ten minutes idle costs only about 9p.

Tip no. 2: don’t boil more water than you need

Suppose you boil 0.5 litre more water than you need. With a specific heat of 4.2 kJ/kgK and assuming cold supply at 10°C, the extra heat supplied is 0.5 x 4.2 x (100-10) = 189 kJ = 0.05 kWh or 2.6 pence worth. Verdict: trivial.

Tip no. 3: use a shower rather than a bath

Let’s look first at the cost of a bath using gas-fired hot water. I’ll assume 100 litre (kg) cold feed at 10°C and bathwater heated to 45°C. At a specific heat of 4.2 kJ/kgK that needs 100 x 4.2 x (45-10) = 14,700 kJ of net heat. Assuming 80% boiler efficiency that equates to 18,375 kJ gross , i.e. 5.1 kWh or say 77 pence.

Contrast that with 10 minutes in an 11kW electric shower: that’s 11  x 10/60 = 1.8 kWh, costing 94 pence, a bit more than the bath. To name a saving you’d need to limit yourself to 8 minutes in the shower. Verdict: marginal

What about a shower fed from the gas heating? Suppose it’s a combi boiler with 16 kW water-heating capacity operating at 80% efficiency (ie 20 kW input) again for ten minutes. That would use 20 x 10/60 = 3.3 kWh of gas, costing 50 pence (27 pence less than the bath). Verdict: unexciting

Tip no. 4: turn off unwanted lights

Let’s take for our example an LED lamp rated at 10 watt. That will cost about 3 pence per hour to run but unlike ovens, kettles and baths, one tends to have a lot of them and use them continually so their cumulative effect in a  household could be relatively costly. Eight such lamps run on a daily basis for four hours more than needed would add 8 x 4 x 10 x 365 = 116.8 kWh per year, costing an extra £61 per year. Verdict: do it


The energy-conscious organisation

In 2019 I was involved in the “Energy Conscious Organisation” initiative promoted by the Energy Services and Technology Association. This programme is about behaviour change not in the normal sense (something which organisations promote on the shop floor) but fostering a more holistic approach, bringing in the design and procurement of assets, for example, or addressing maintenance policies. It amounts to organisational culture change drawing in management and professional functions. I think an “Energy Conscious Organisation” could be characterised as follows. It minimises its use of fuel and electricity by…

  • Engaging and involving everyone at all levels and in all functions;
  • Encouraging vigilance, facilitating resolution of problems and exploiting opportunities;
  • Developing individuals’ skills and knowledge as needed;
  • Adapting its policies and processes to guarantee continual improvement;
  • Measuring, monitoring and reporting the results

For brevity we could reduce this to five watchwords: Vigilance—Engagement—Skills—Monitoring—Adaptation. If only that had a memorable acronym.

Air-con bolt-on

Bulletin reader Adam F. is plagued by emails from a company selling a bolt-on thermostatic control for split-system air conditioning units. They claim ‘up to 40%’ savings. Is this plausible?

Now the rate of heat flow into an air-conditioned space is proportional to the outside-inside temperature difference (barring changes in ventilation rate and ignoring solar gain, which I will come back to). Let’s suppose you are maintaining 18°C indoors: the rate of heat inflow when it’s 28°C outside will be double what it is when it is 23°C (a ten-degree differential compared with a five-degree differential).

To maintain steady internal conditions the heat inflow must be balanced by an equal amount of cooling. There are two ways to reduce the energy used for cooling:

  1. reduce the rate of heat inflow; or
  2. improve efficiency or reduce losses in the refrigeration plant which provides the cooling

Solutions based on improved thermostatic control address the first option, and they claim to do so by preventing overshoot whereby the evaporator (indoor unit) continues to cool the space after the set point has been reached and it has turned off. The effect of such overshoot, if it occurs, will be to depress the internal temperature slightly. The heat flow into the space will accordingly increase slightly, balancing the excess cooling that has been supplied. But how significant will the effect be? Ultimately it depends on the impact on average internal temperature over time. Remember that the overshoot will be transitory, but let’s be pessimistic and suppose that it gives an average space temperature that is 0.2°C lower than it need be. With an outside-inside differential of 5 degrees, that would imply only 4% excess heat flow and corresponding cooling load. But this is 4% of quite a low load; if the system were sized for a 20-degree differential a 0.2°C offset in space temperature would be adding only 1% to the load when running at design conditions.

But there is a twist. Overshoot can only occur as the thermostatic control commands the cooling to turn off. This may be quite frequent at low loads, but becomes less so as the load increases and the cooling spends a greater proportion of its time running. So the hotter the weather and the harder the cooling has to work, the less waste there will be in absolute terms, and this smaller absolute waste becomes an infinitesimal percentage of the higher demand. Solar gain, when it occurs, increases the load on the cooling system, which reduces the number of start-stop cycles by lengthening the ‘on’ periods and hence cuts down the opportunities for thermostatic overshoot.

The final thing to bear in mind is that although we have, in this analysis, a range of potential savings from maybe 4% at low load to essentially nil at full load, not much consumption occurs at low load so the potential year-round savings are skewed well away from the 4% figure.

My verdict: plausible savings might be of the order of 1% but only if thermostatic overshoot actually occurs.

Blowing your profits

The ‘Star Spot’ award for June 2022 went to a consultant who spotted completely avoidable waste of compressed air in a factory. Compressed-air systems are both costly to run and prone to hidden losses, so it pays to do what our reader did, namely a walk-round check with his client while the factory was shut for the weekend. They suspected a serious problem because outside working hours there were enough leaks to keep one compressor running almost continuously. As they walked around they found the odd poor joint but when they went outside there was quite a significant hissing from one of the factory’s dust collectors.In this installation the life of the filter bags was prolonged by timed short pulses of compressed air inside the individual bag in order to blow or knock the dust off of the outside of the filter. Unfortunately one of the air lines had become detached upstream of the solenoid valve and was continuously discharging compressed air. With this fixed, the load on the duty air compressor dropped dramatically.

Remember also that all the time the air line was disconnected, the filter bag wasn’t ever being back-flushed: another perfect example of how energy waste often goes hand in hand with loss of service.

Incidentally, it would have been possible to improvise a measurement of the compressed-air savings quite simply. During a period of no demand, you can shut off the compressors and time how long it takes the pressure of the stored air to drop by one bar. Knowing the volume of receivers on the system allows you to compute the rate of air loss. When the pressure drops by one bar, you have lost the receivers’ volume of free air. So for example if you have a 690-litre receiver and it drops from 7 to 6 bar in 30 minutes, the air loss rate is 690/30 litres per minute or the equivalent of over 12,000 cubic metres per year on a continuously-running system. As an efficient compressor takes about 0.1 kWh per m3 of air compressed, that would be wasting 1,200 kWh per year. Repeating the test after attending to leaks would show you how much you had saved; repeating it periodically allows you to monitor for deterioration.

Savings in electric motors

Bulletin reader Matt contacted me after seeing a presentation on replacement electric motors. The sales person claimed they could save 50% energy on a like-for-like replacement of an IE3 motor. Matt quite correctly challenged them to explain how they could save 50% on a motor that’s 90%+ efficient, and of course they could not give a scientific answer.

They might have meant that their motor technology halved the losses in the motor, taking it from say 90% to 95% efficient. But that would result in about 5.3% saving, not 50%. The only way to reduce the energy consumption of a motor by an order of magnitude is to reduce how much work it does. Actually that is entirely possible; it’s what variable-speed control does. On centrifugal fans, for example, a 20% speed reduction almost halves the mechanical power absorbed by the fan and that, thanks to the principle of an energy balance, translates into a corresponding reduction of the power delivered by its motor and hence the power that the motor draws from the mains. So maybe the vendor was not talking about a like-for-like replacement but the replacement of fixed-speed with variable-speed motors. In which case speed-control on the existing motors could be considered as an option.

Anyway, speed control would be one way that the vendor might have achieved their 50% savings. But that would be savings on motor power alone, while their web site trumpets 40-60% savings ‘overall’ on heating, ventilation and air conditioning systems. Also not completely impossible, but (again invoking the principle of an energy balance) it implies that the building’s demand for heating or cooling was reduced by that much. However, short of using the fan-speed control aggressively to cut back the ventilation rate drastically, it is hard to see how that could be achieved.