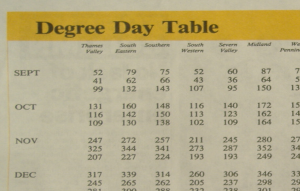
Another exhibit for the Museum of Energy Management: thanks to David Bridger for unearthing UK monthly degree-day data for the period 1966 to 1975 (view the complete archive file here ).
These data have mainly curiosity value and should not be relied upon for any kind of trend analysis. Observing stations have sometimes been moved or affected by nearby building development and urban expansion. Region 18 (North West Scotland) was not even included at all until I launched the Degree Days Direct subscription service in 1992, and there had been two other main data providers before I got the contract to supply the official figures in 2003, so it would be risky to assume continuity over the whole fifty years.
Below: degree-day figures reported in the government’s “Energy Management” newspaper in 1986
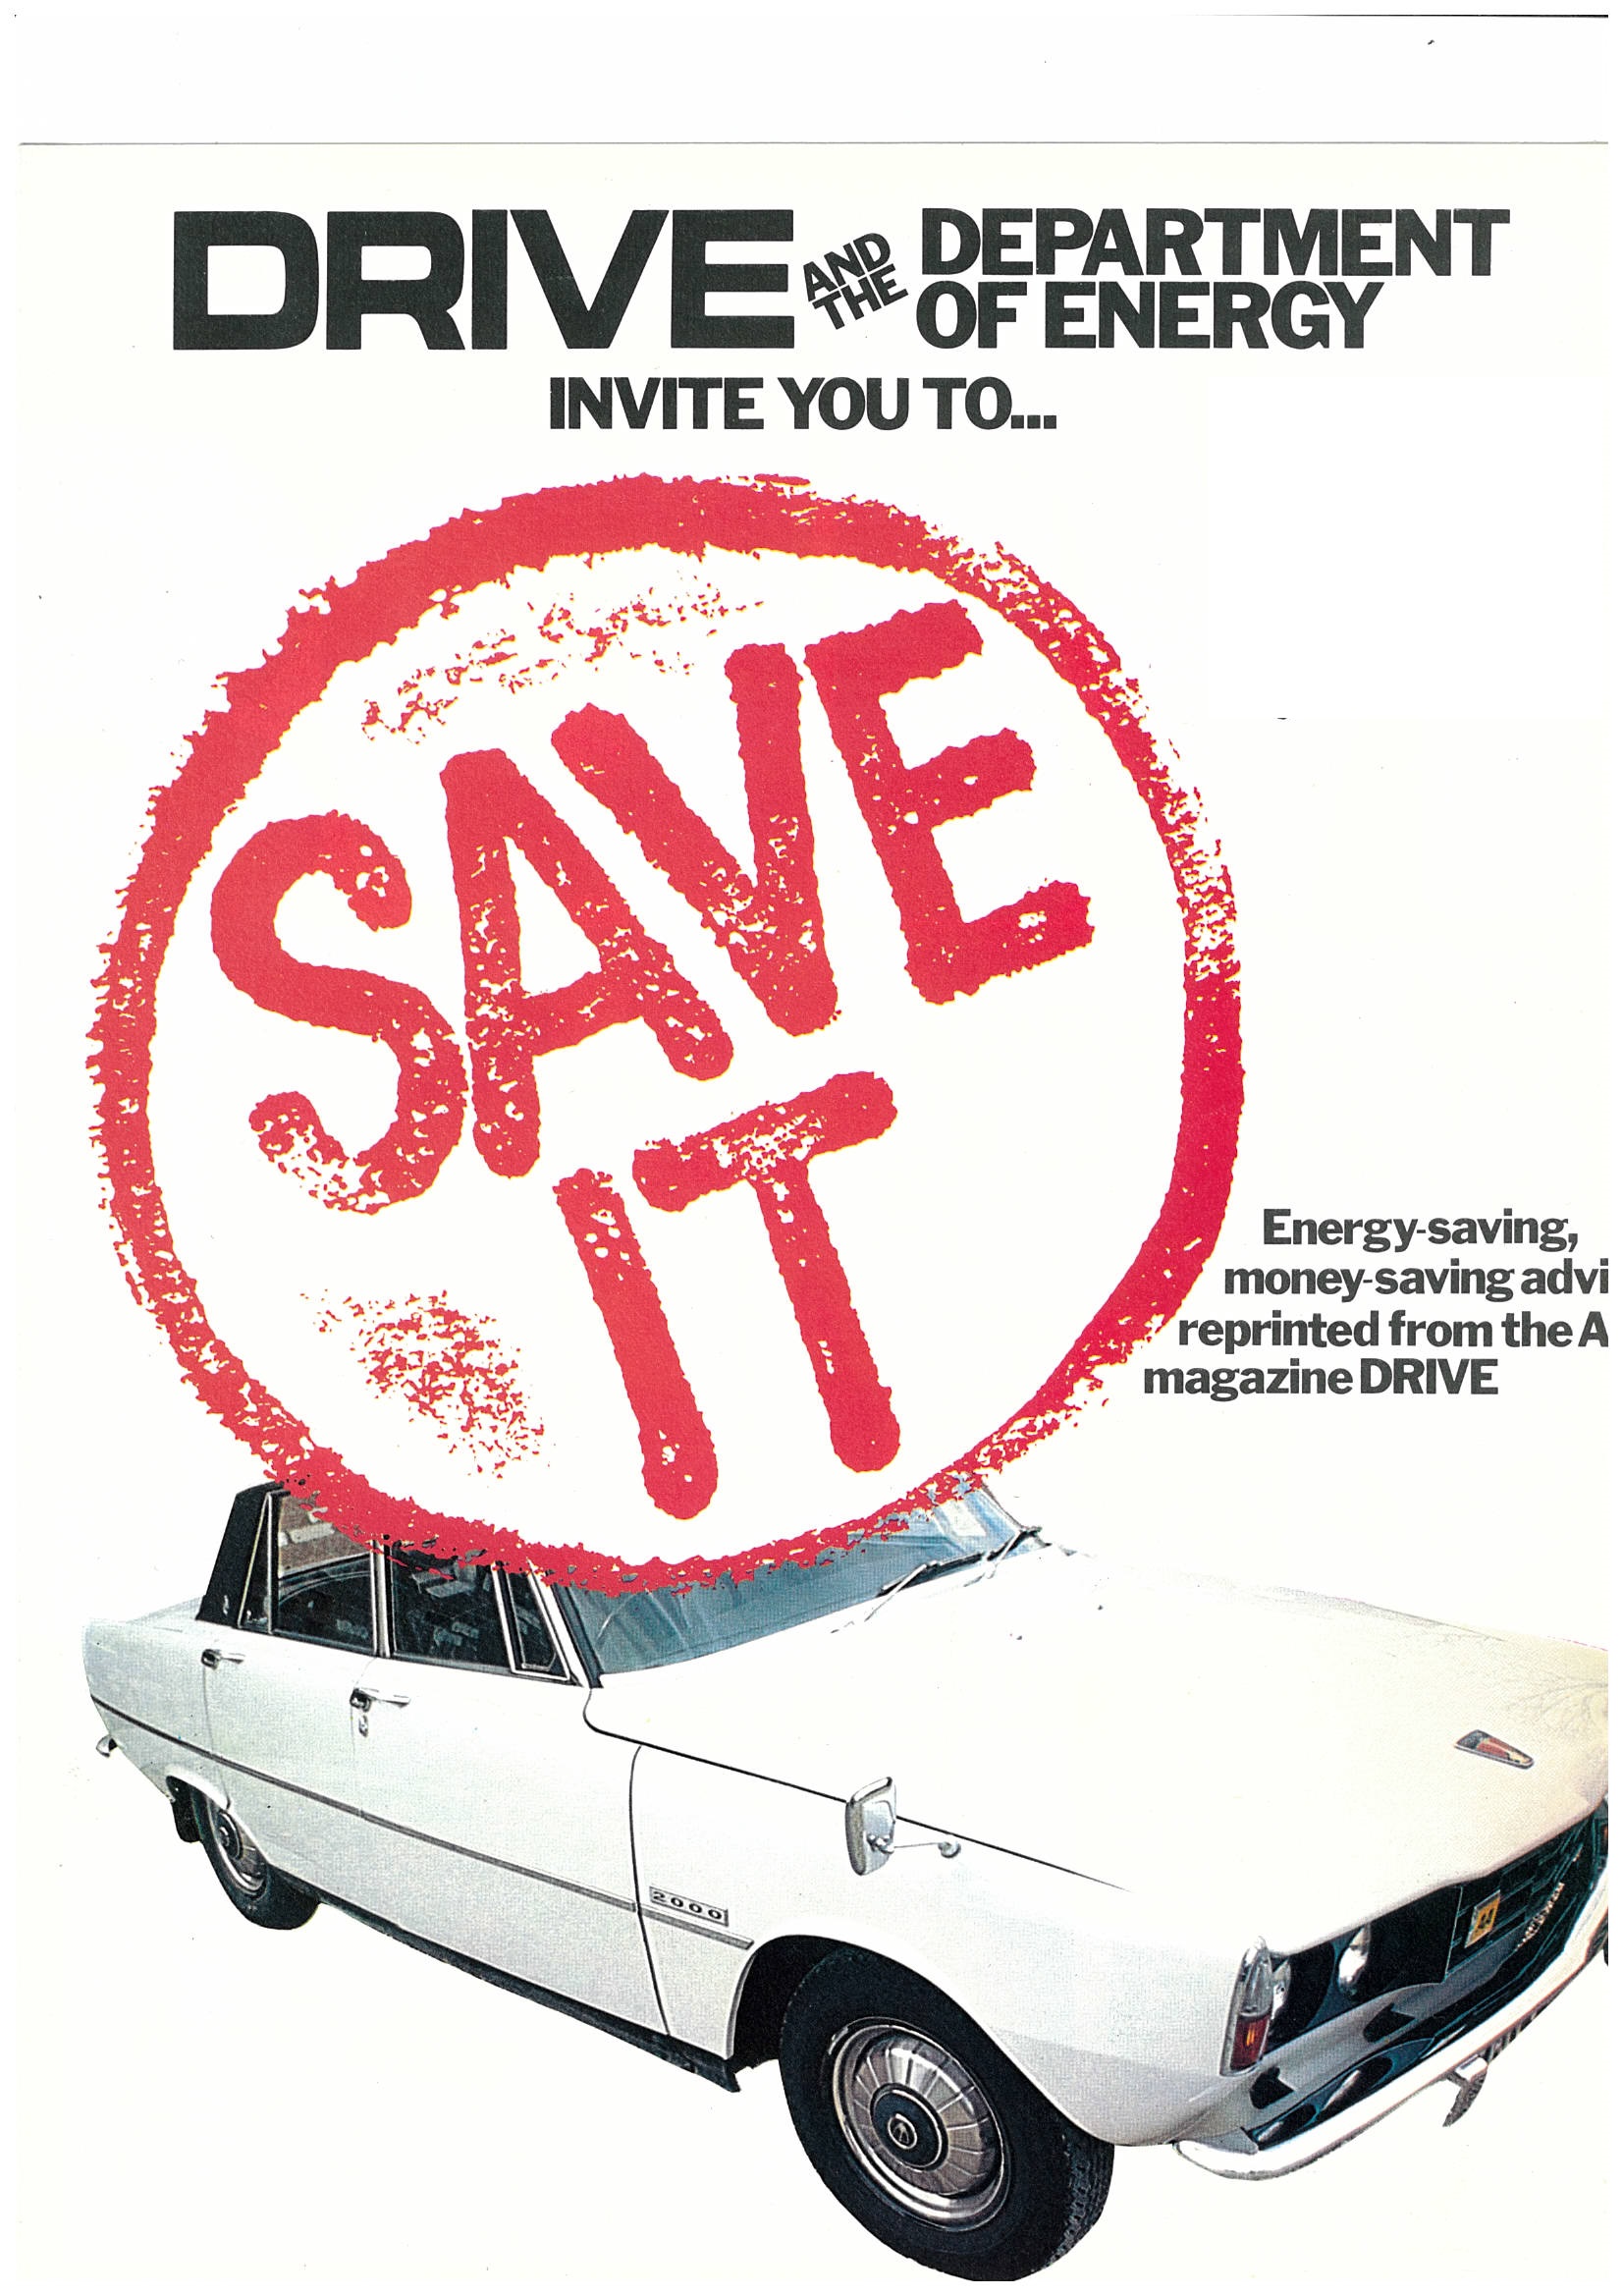
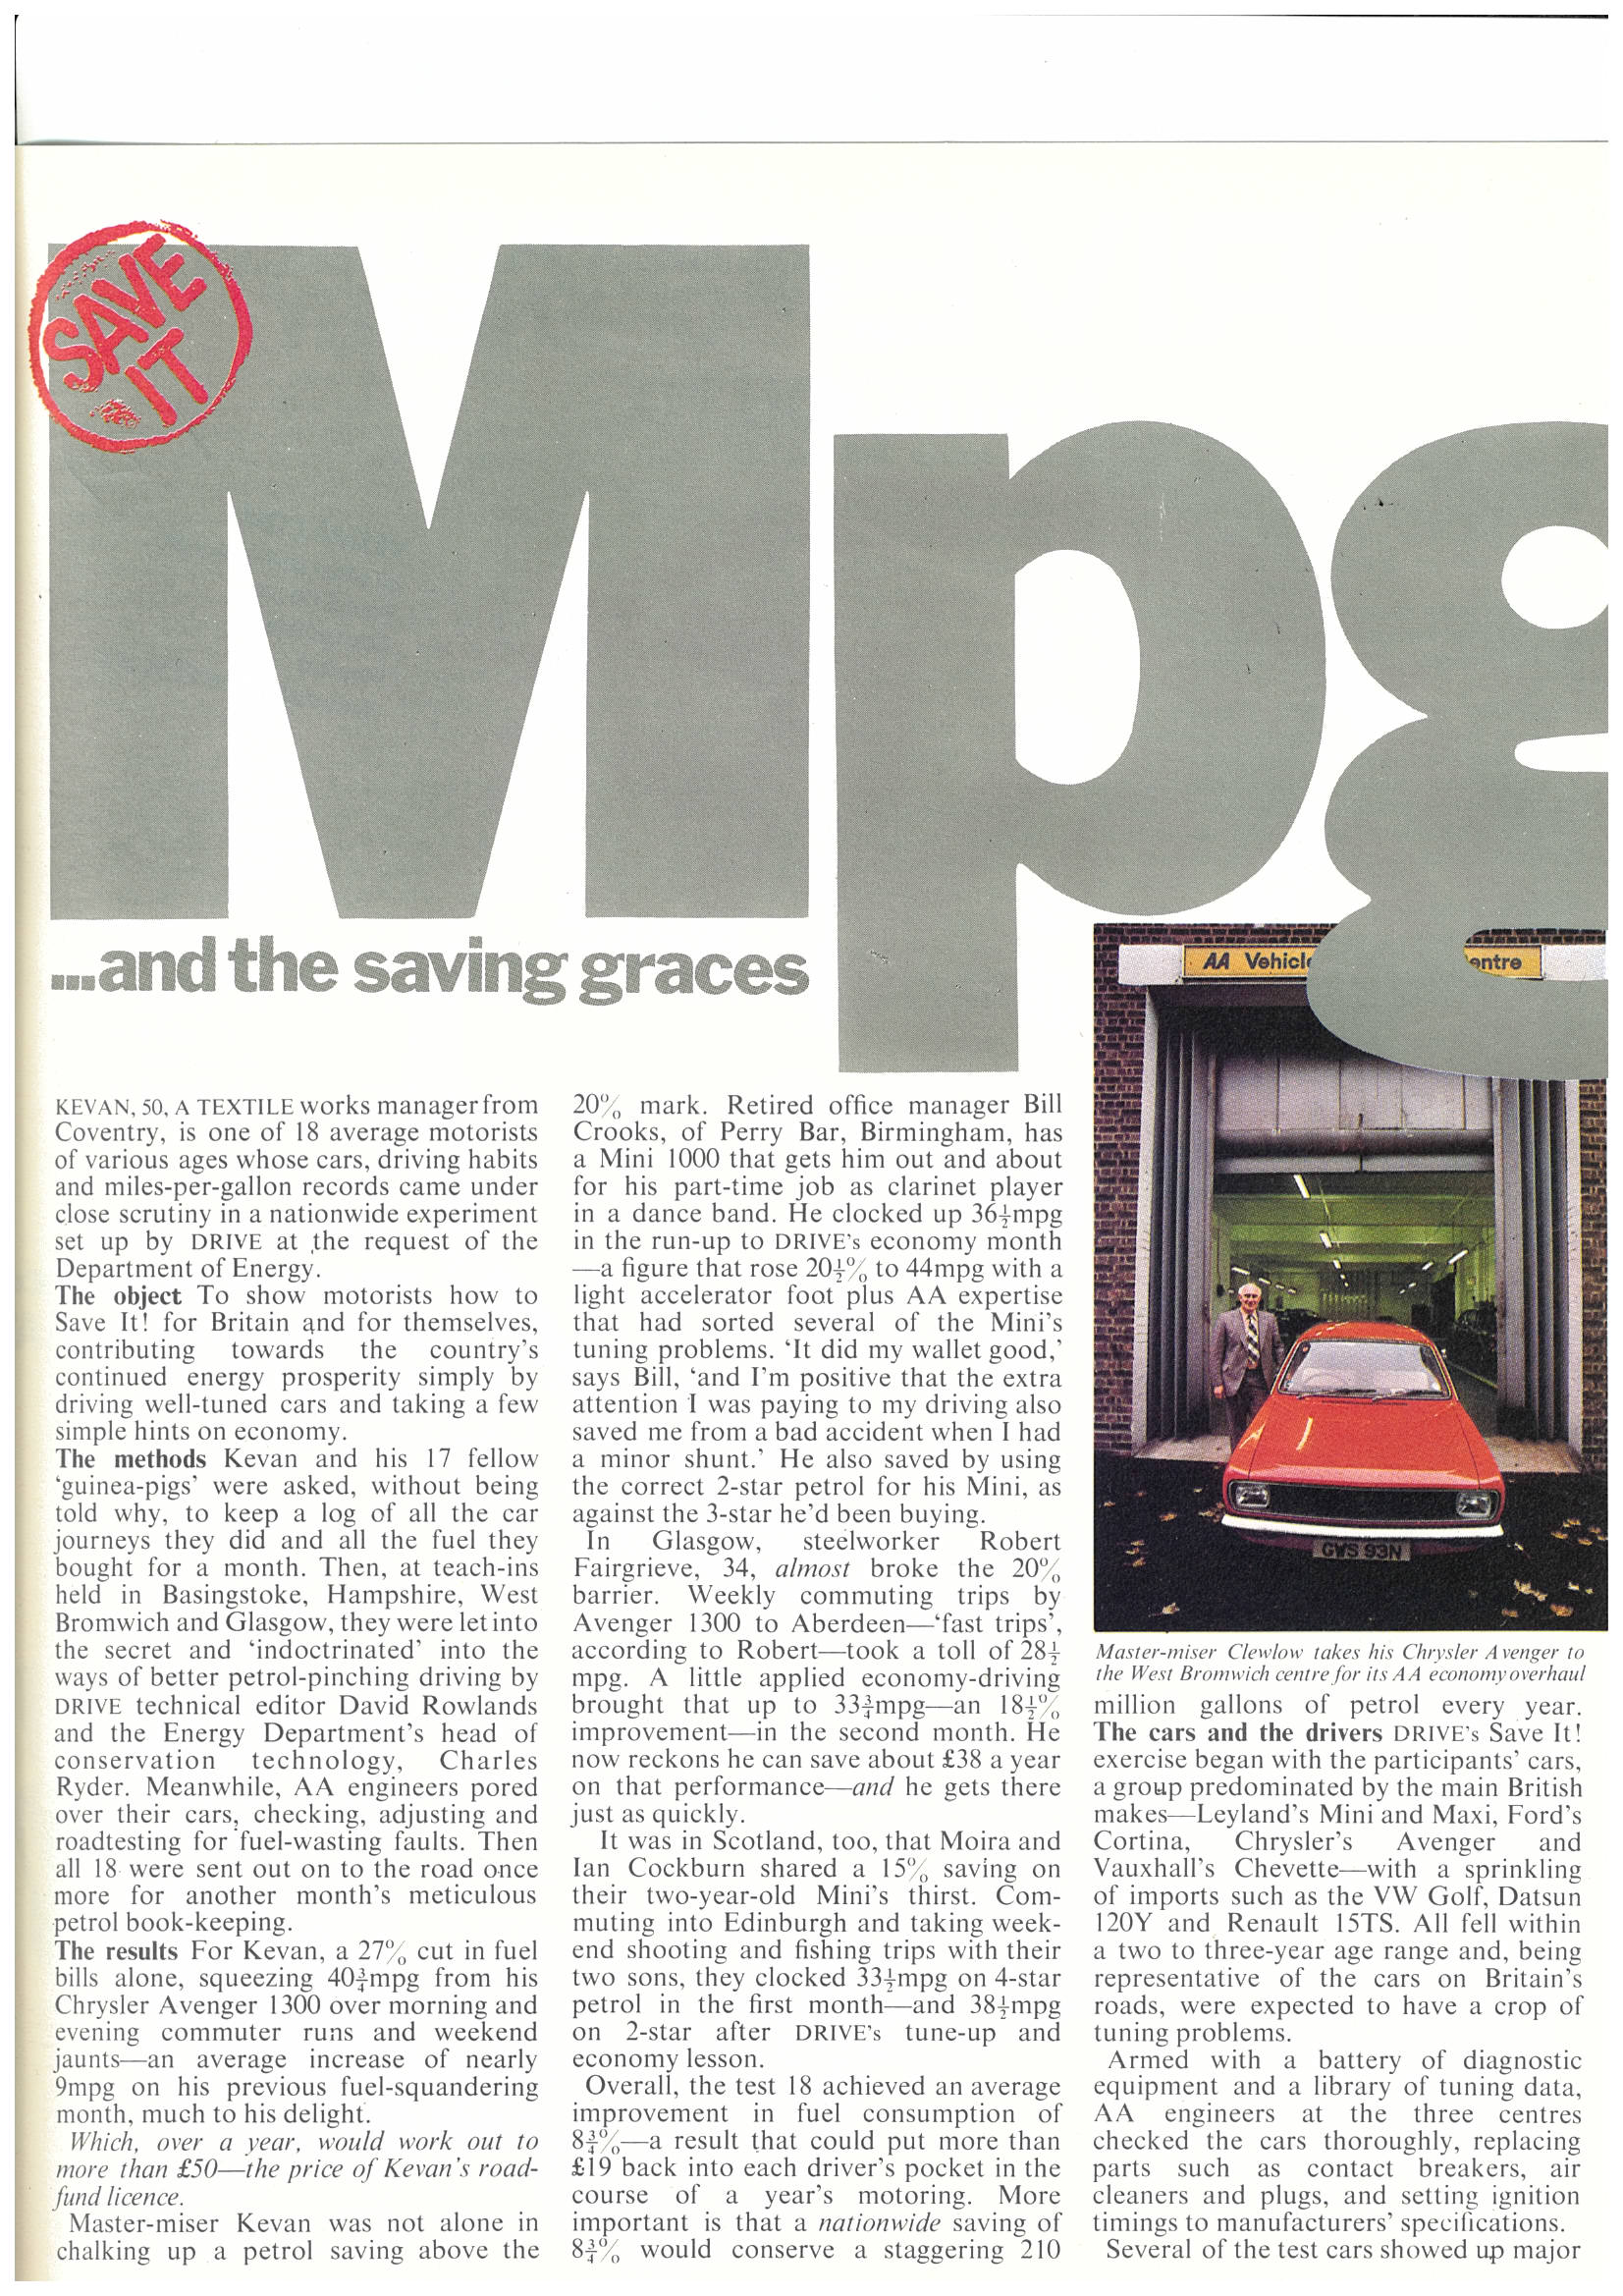
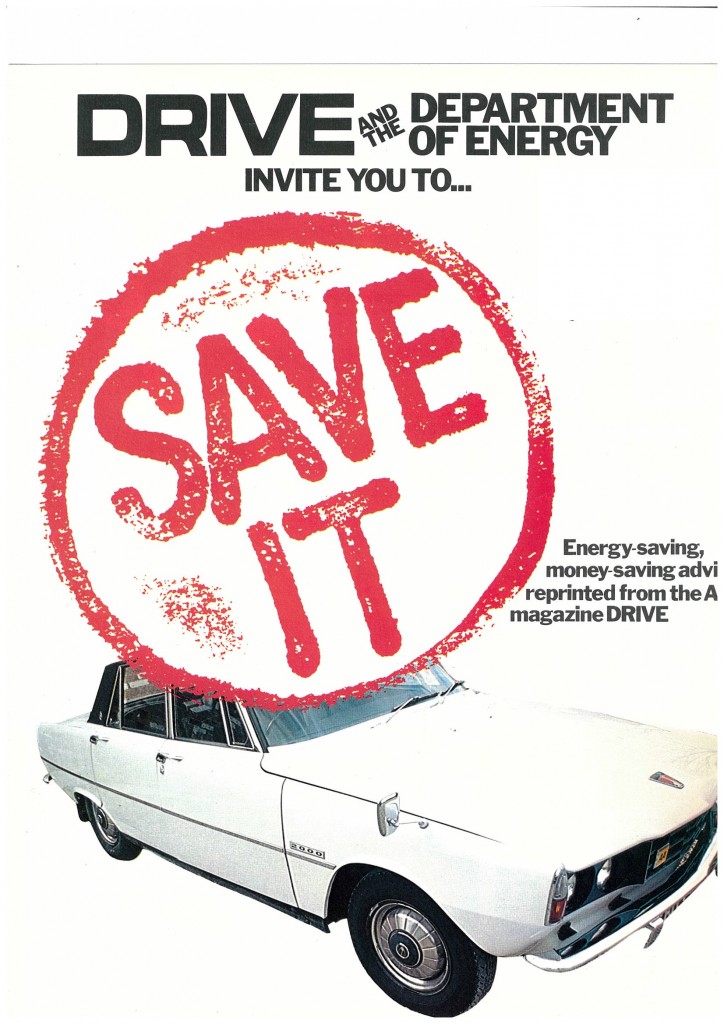
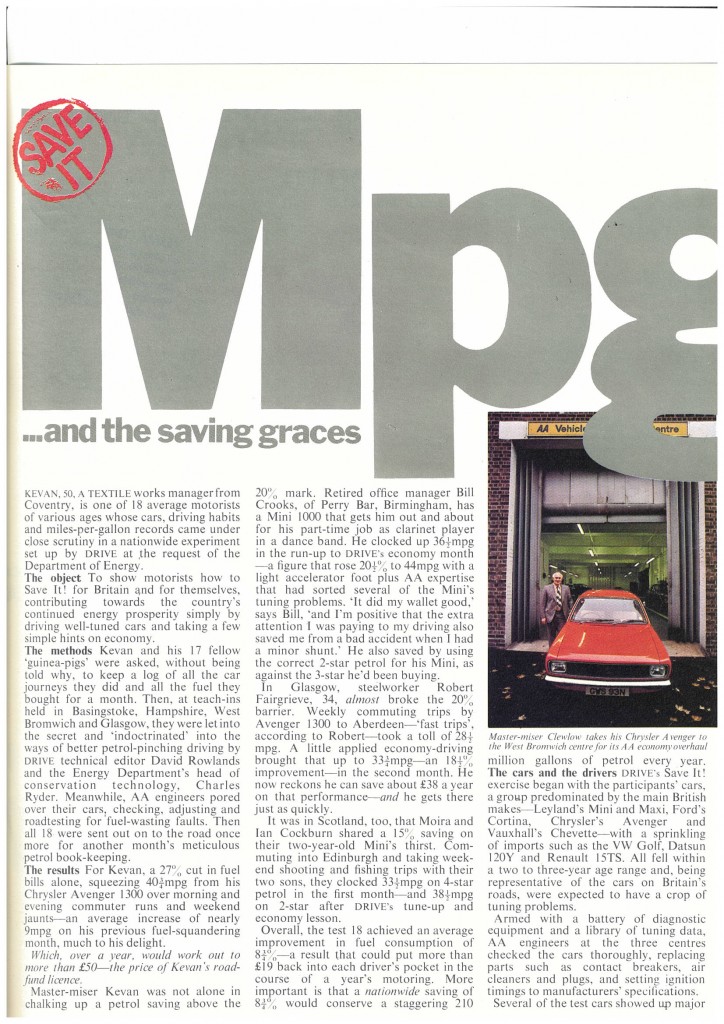
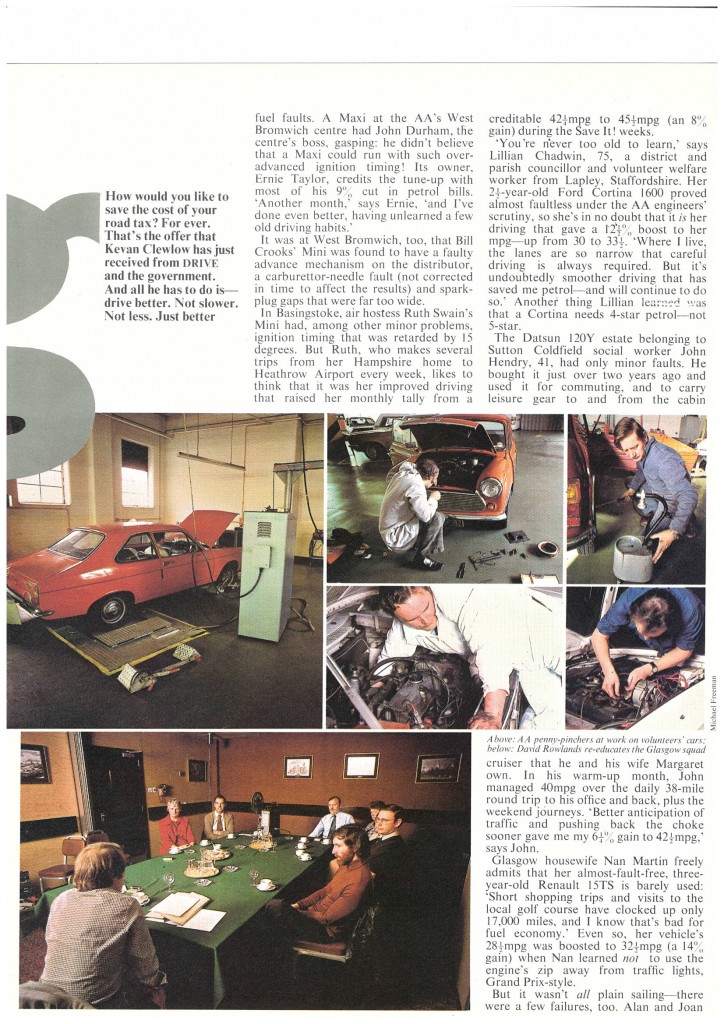
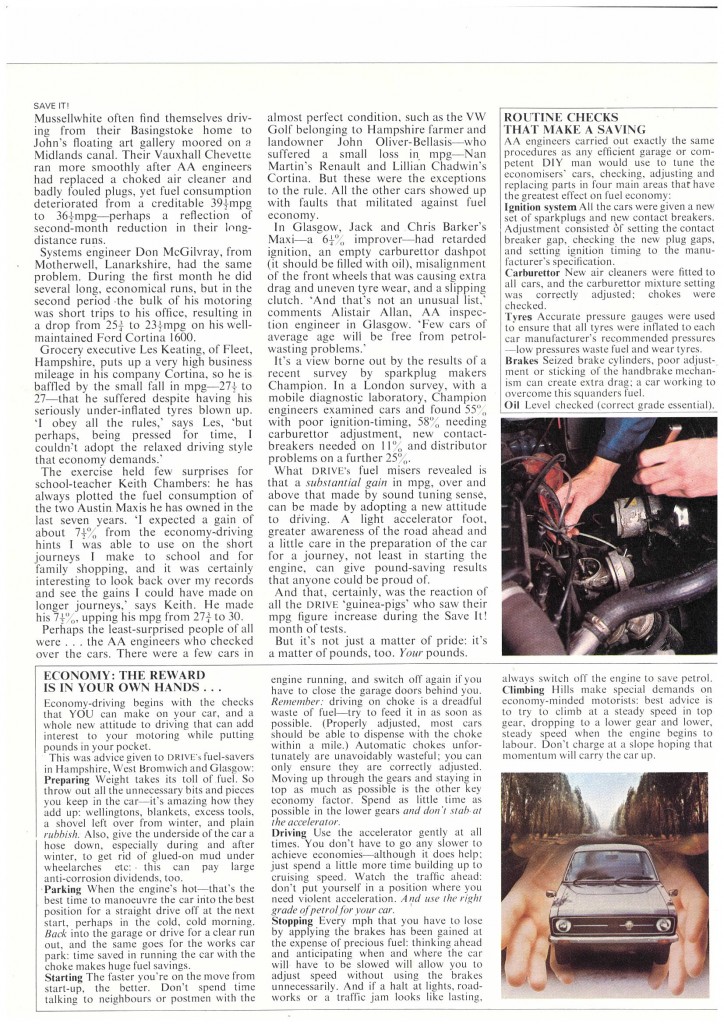
More from the Museum of Energy Management: to judge from the N-plated orange cars in the photos, this vehicle fuel efficiency leaflet dates from about 1978…
More from the museum of energy management…
 The UK’s first energy manager was Oliver Lyle, managing director of the eponymous sugar refinery in London. He was successful not only because he was in a position of influence but also because he was a very capable engineer. Fuel efficiency was mission critical to him both during the war (because of rationing) and afterwards when the effect of rationing was compounded by economic growth.
Lyle’s book The Efficient Use of Steam, published by the Ministry of Fuel and Power in 1947, remains a technical classic and is written in a most engaging style. In one of my favourite passages he talks about my pet subject, the analysis of fuel consumption. He notes that energy performance seemed to be systematically better in weeks when the factory had been bombed. He remarks that common sense suggests that the opposite would seem more likely; “I can only conclude”, he writes, “that people were too busy clearing up the mess to take proper charts and meter readings”.

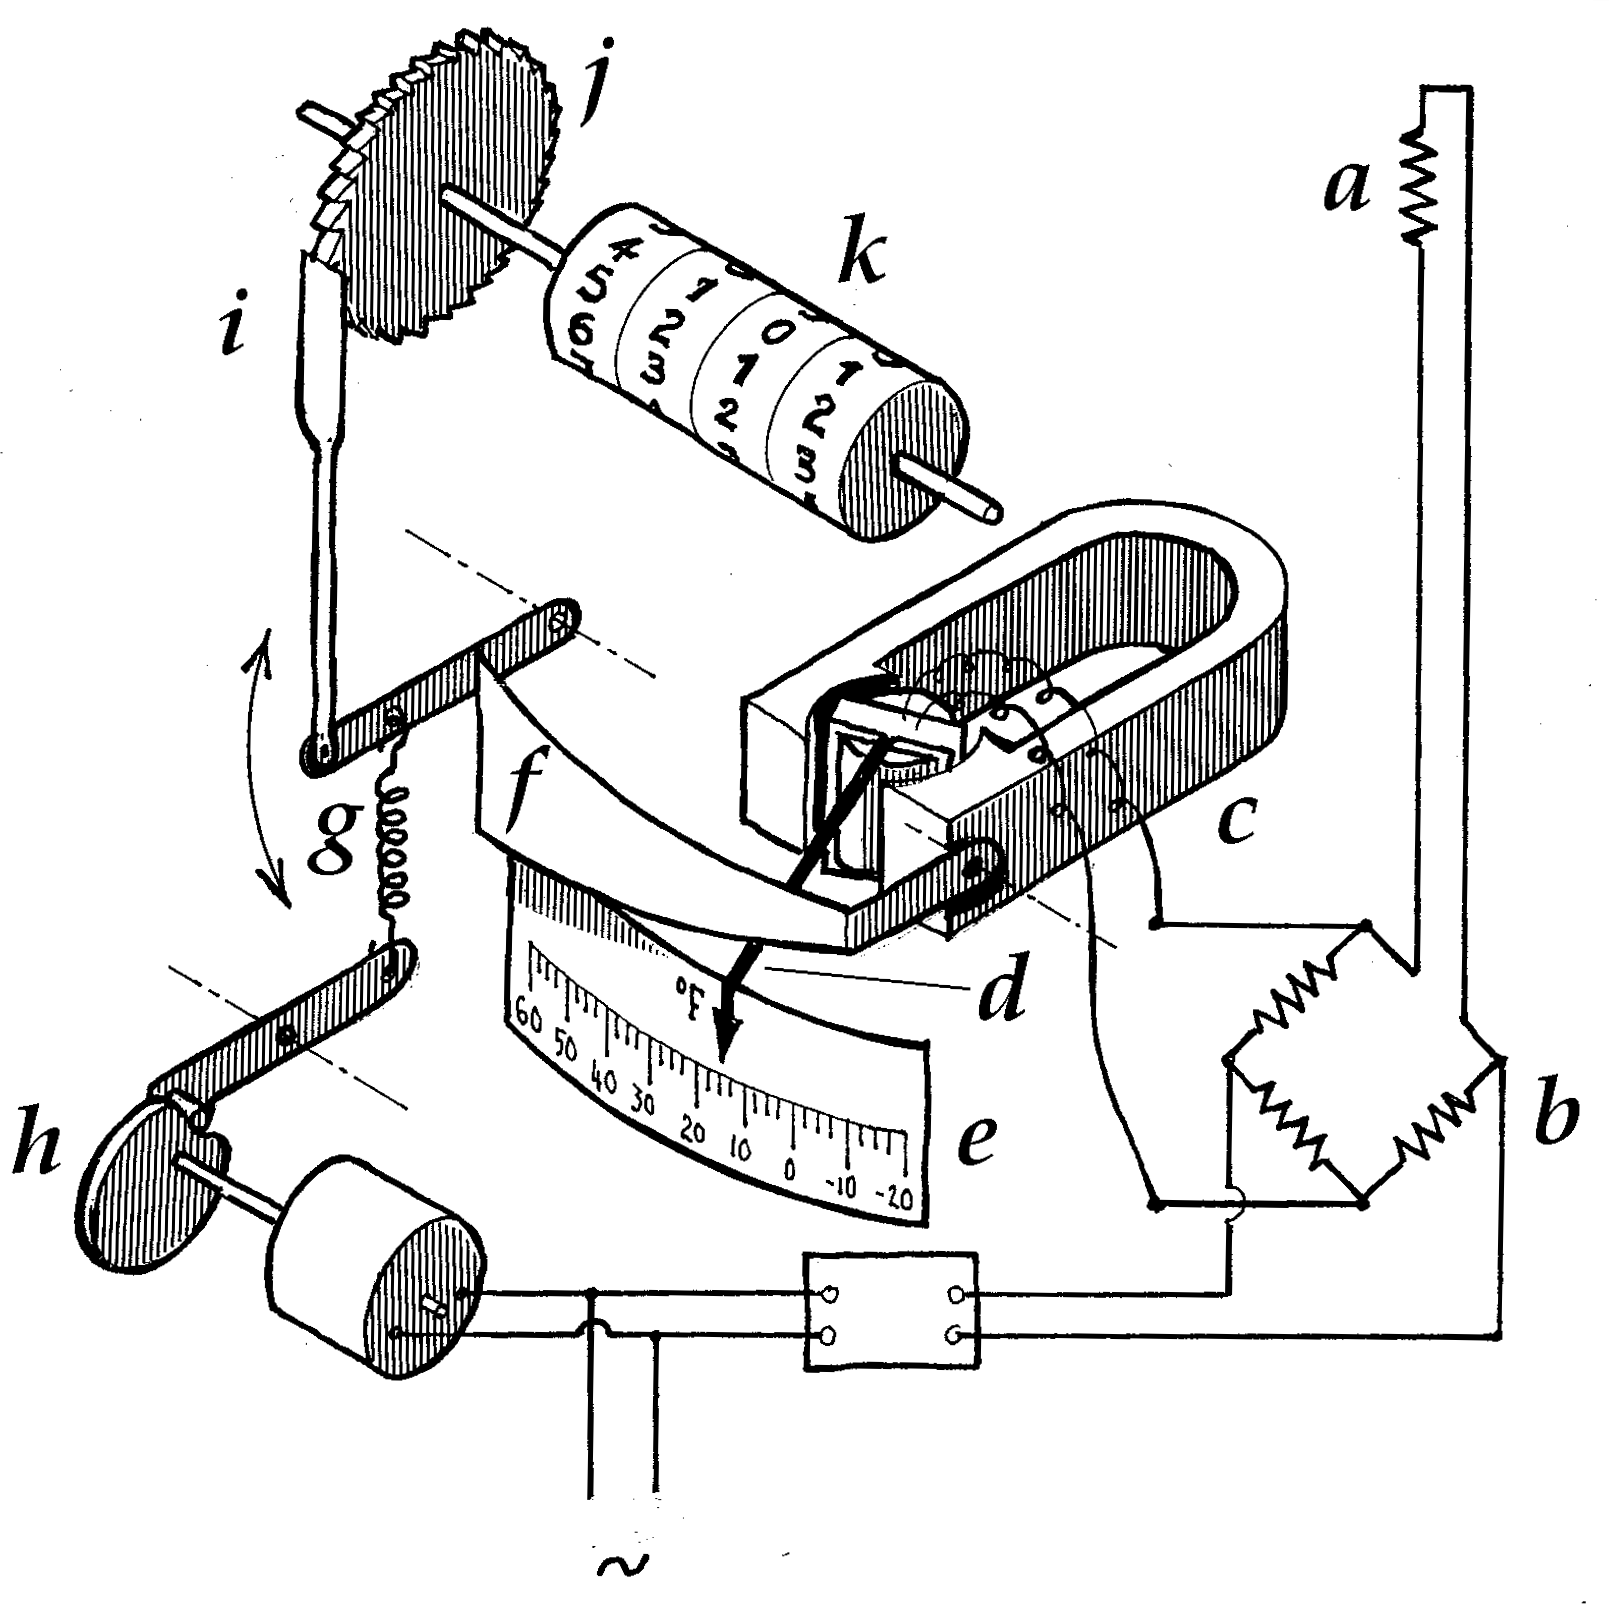
I’m indebted to Dr Peter Harris for unearthing this curiosity, published in the journal of the Institute of Heating and Ventilating Engineers in 1936. It is a design for a “degree-day meter” whose purpose was to summarise how cold the weather had been over a given period (a month, say). This is how it works: a resistance thermometer a is mounted outdoors and connected via a Wheatstone Bridge b to a moving coil galvanometer c whose pointer d moves horizontally across a scale e, marked from 60°F on the left to -20°F on the right. It thereby indicates the outside air temperature. Above the pointer is a tapered chopper bar f, moved up and down by a light spring g driven by a rotating cam h. Because the chopper bar is tapered, its vertical travel is constrained to an increasing extent as the pointer moves leftward indicating higher temperatures. Conversely, its vertical travel will be greater the lower the temperature, as the pointer moves to the right. The intermittent vertical travel of the chopper bar is transmitted via a pawl i and ratchet-wheel j to a cyclometer counter k which shows the total vertical travel. The counter will advance more rapidly when it is colder and more slowly when it is warmer outside, and it is so arranged that when the temperature exceeds 60°F there will be no vertical play and the counter will not advance at all.
Because a building’s heating power requirement at any given moment is proportional to the temperature deficit, the accumulated deficit over any given period of days (as measured by this meter) is proportional to the total thermal energy lost from the building, which needs to be made up by the heating system. Because it measures the time integral of temperature deficit, its units of measurement are degree-days (analogous to man-hours) and the threshold temperature of 60°F survives today as the common degree-day base temperature of 15.5°C.
Energy Management Register