In statistical analysis the coefficient of determination (more commonly known as R2) is a measure of how well variation in one variable explains the variation in something else, for instance how well the variation in hours of darkness explains variation in electricity consumption of yard lighting.
R2 varies between zero, meaning there is no effect, and 1.0 which would signify total correlation between the two with no error. It is commonly held that higher R2 is better, and you will often see a value of (say) 0.9 stated as the threshold below which you cannot trust the relationship. But that is nonsense and one reason can be seen from the diagrams below which show how, for two different objects, energy consumption on the vertical or y axis might relate to a particular driving factor or independent variable on the horizontal or x axis.
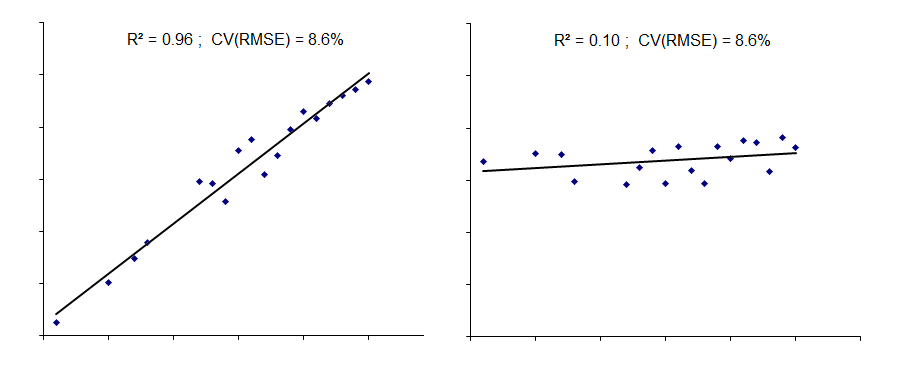
In both cases, the relationship between consumption and its driving factor is imperfect. But the data were arranged to have exactly the same degree of dispersion. This is shown by the CV(RMSE) value which is the root mean square deviation expressed as a percentage of the average consumption. R2 is 0.96 (so-called “good”) in one case but only 0.10 (“bad”) in the other. But why would we regard the right-hand model as worse than the left? If we were to use either model to predict expected consumption, the absolute error in the estimates would be the same.
By the way, if anyone ever asks how to get R2 = 1.0 the answer is simple: use only two data points. By definition, the two points will lie exactly on the best-fit line through them!
Another common misconception is that a low value of R2 in the case of heating fuel signifies poor control of the building. This is not a safe assumption. Try this thought experiment. Suppose that a building’s fuel consumption is being monitored against locally-measured degree days. You can expect a linear relationship with a certain R2 value. Now suppose that the local weather monitoring fails and you switch to using published degree-day figures from a meteorological station 35km away. The error in the driving factor data caused by using remote weather observations will reduce R2 because the estimates of expected consumption are less accurate; more of the apparent variation in consumption will be attributable to error and less to the measured degree days. Does the reduced R2 signify worse control? No; the building’s performance hasn’t changed.
Footnote: for a deeper, informative and highly readable treatment of this subject see this excellent paper by Mark Stetz.