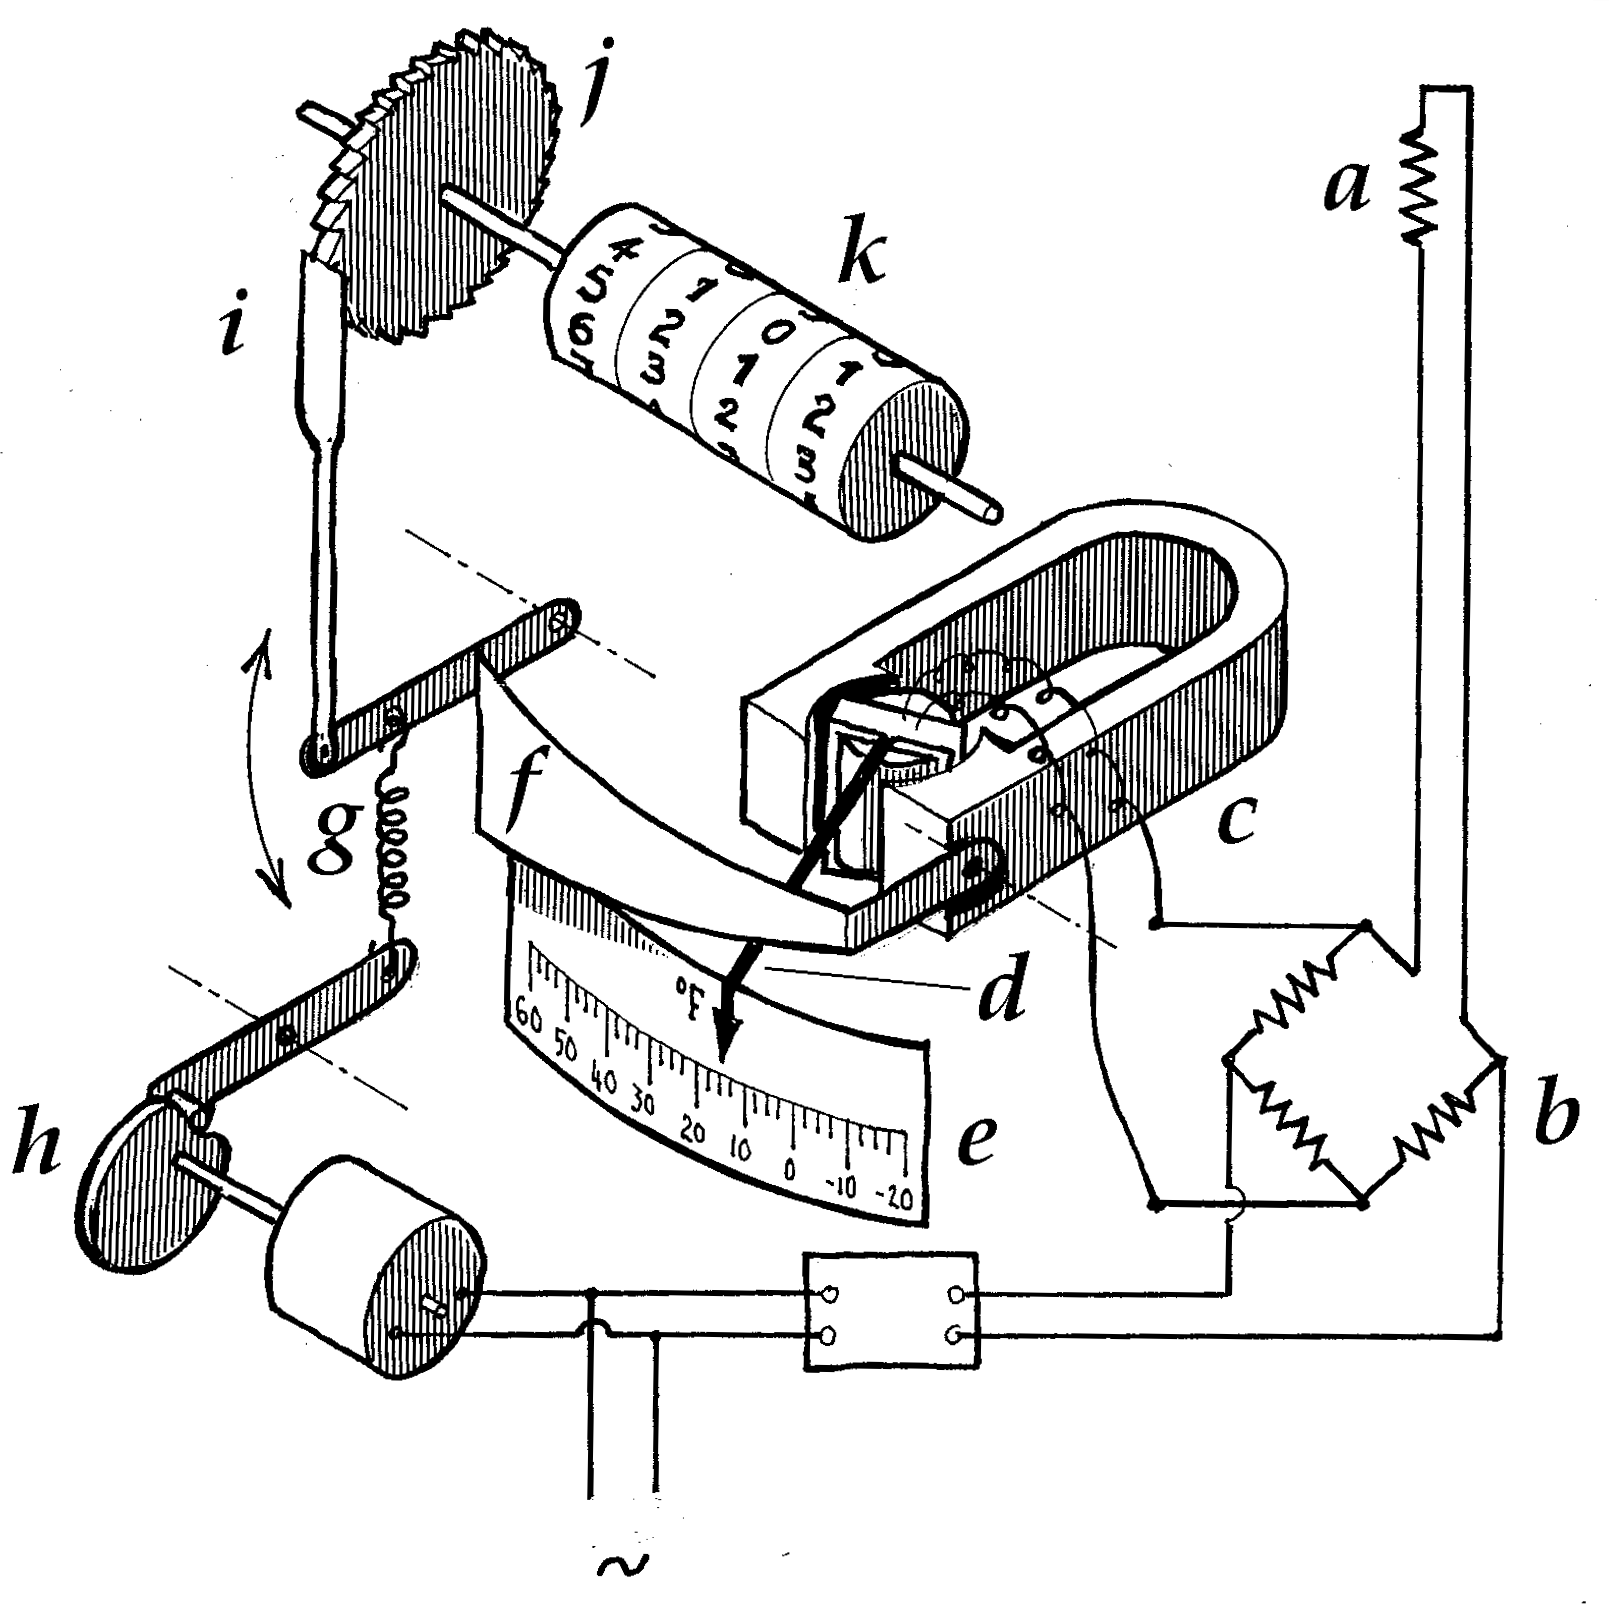
All posts by Editor

Estimating savings from building-fabric improvements

If you improve a building’s insulation, or reduce its ventilation rate, the resulting energy saving can be estimated using simple formulae in combination with relevant weather-data tables. In the case of an improvement to insulation of an individual element of the building envelope, the approximate formula for annual fuel savings is

0.024 x (UOLD – UNEW) x A x DDA / EFF                         (kWh)

where  UOLD and UNEW are the original and improved U-values (W/m2K), and A is the area of building element being improved (m2).  EFF is heating-system efficiency, for which it would be reasonable to assume a value in the range of 0.8 to 0.9, reflecting the fact that 10-20% of the fuel used is accounted for by combustion losses.

DDA meanwhile is the annual heating degree-day figure, which is a measure of how cold the weather was in aggregate. Degree-day totals tend to be higher in the north and lower in the south; and they also depend on the outside temperature below which a given building’s heating needs to be turned on (the ‘base’ temperature). Selected totals are given in Table 1 for various regions and base temperatures. Buildings with high space temperatures and low casual heat gains have higher base temperatures, implying higher annual degree-day totals and thus bigger expected savings for a given improvement to their insulation.

Turning to the effect of reducing the building’s ventilation rate, we need to know the reduction in air throughput, RDV. If we express RDV in m3/day, the annual energy savings are given by this approximate formula:

(0.008 x RDV x DDA) / EFF                   (kWh)

DDA and EFF have the same meanings as before.

Use for air conditioning

The same techniques can be used to gauge the effect of reduced cooling load. In this case we use cooling degree days (examples in Table 2) and EFF is likely to be in the range 2 to 4, representing the chiller coefficient of performance. Saving one kWh of cooling effect saves much less than a kWh of electricity.

Base temperatures

The base temperature for heating depends on the temperature set-point, the construction of the building, how it is used, how densely it is populated and how much casual heat gain it experiences from lighting and equipment. It is invariably below the internal set-point temperature. How far below can be determined in various ways but there would typically be about 4°C difference.

Similar considerations apply to cooling: the cooling base temperature is the temperature above which it becomes necessary to run air conditioning. If you know air-conditioning is used throughout the year, a very low base (say 5°C) is appropriate. Otherwise something of the order of 15°C could be a reasonable assumption.

Table 1: Annual heating degree days1

Base temperature: 20°C 15°C 10°C
South West   3,189   1,576      503
Midland   3,632   2,033      860
N E Scotland   4,075   2,355   1,003

Table 2: Annual cooling degree days1

Base temperature: 25°C 15°C 5°C
South West          2      233   2,386
Midland          6      274   2,111
N E Scotland    0      111   1,649

1 The full tables can be downloaded from www.vesma.com. Click on ‘D’ in the A-Z index and look for ‘degree days’.

Accurate meter readings: a managing director’s view

More from the museum of energy management…

books_lyle
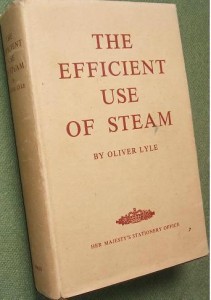
The UK’s first energy manager was Oliver Lyle, managing director of the eponymous sugar refinery in London. He was successful not only because he was in a position of influence but also because he was a very capable engineer. Fuel efficiency was mission critical to him both during the war (because of rationing) and afterwards when the effect of rationing was compounded by economic growth.

Lyle’s book The Efficient Use of Steam, published by the Ministry of Fuel and Power in 1947, remains a technical classic and is written in a most engaging style.  In one of my favourite passages he talks about my pet subject, the analysis of fuel consumption. He notes that energy performance seemed to be systematically better in weeks when the factory had been bombed. He remarks that common sense suggests that the opposite would seem more likely; “I can only conclude”, he writes, “that people were too busy clearing up the mess to take proper charts and meter readings”.

Accounting for the weather: an early degree-day meter

ddmeter1

I’m indebted to Dr Peter Harris for unearthing this curiosity, published in the journal of the Institute of Heating and Ventilating Engineers in 1936. It is a design for a “degree-day meter” whose purpose was to summarise how cold the weather had been over a given period (a month, say). This is how it works: a resistance thermometer a is mounted outdoors and connected via a Wheatstone Bridge b to a moving coil galvanometer c whose pointer d moves horizontally across a scale e, marked from 60°F on the left to -20°F on the right. It thereby indicates the outside air temperature. Above the pointer is a tapered chopper bar f, moved up and down by a light spring g driven by a rotating cam h.  Because the chopper bar is tapered, its vertical travel is constrained to an increasing extent as the pointer moves leftward indicating higher temperatures.  Conversely, its vertical travel will be greater the lower the temperature, as the pointer moves to the right. The intermittent vertical travel of the chopper bar is transmitted via a pawl i and ratchet-wheel j to a cyclometer counter k which shows the total vertical travel. The counter will advance more rapidly when it is colder and more slowly when it is warmer outside, and it is so arranged that when the temperature exceeds 60°F there will be no vertical play and the counter will not advance at all.

Because a building’s heating power requirement at any given moment is proportional to the temperature deficit, the accumulated deficit over any given period of days (as measured by this meter) is proportional to the total thermal energy lost from the building, which needs to be made up by the heating system.  Because it measures the time integral of temperature deficit, its units of measurement are degree-days (analogous to man-hours) and the threshold temperature of  60°F survives today as the common degree-day base temperature of  15.5°C.

A little light reading

DATELINE 1 APRIL 2015: Got your shopping basket and cheque-book ready? Let’s build that library of energy-management systems standards!

We’ll start with ISO 50001 “Energy management systems. Requirements with guidance for use” at £174 (or bizzarely, £12 less for the laminated version), and to make sure we implement it correctly, fork out £212 for ISO 50004 “Energy management systems. Guidance for the implementation, maintenance and improvement of an energy management system”. To help us understand it all we might add PD CEN/CLC TR 16103 “Energy management and energy efficiency. Glossary of terms”. That’s only an extra £152 but we can probably pass up on ISO 9229 “Thermal insulation. Vocabulary” (£200) especially as the subject seems also to be covered in the cheaper ISO 9251  “Thermal insulation. Heat transfer. Conditions and properties of materials. Vocabulary” at just £90.

Stay with me… Next, we will almost certainly want to do some energy audits. ISO 50002:2014 ED1 “Energy audits. Requirements with guidance for use” would seem to cover the ground, and at £103 it’s £5 less than the European Standard EN 16247-1 “Energy audits. General requirements”. But – decisions, decisions – EN 16247 also boasts other sub-standards: Part 2 for buildings at £192; Part 3, processes at £146; and Part 4, transport at £104 (the prices differ because they charge per page). If we want to use benchmarking we could pick up a copy of EN 16231 “Energy efficiency benchmarking methodology” for only £152, and thinking about the qualifications of the people doing the work we should add PAS 51215 “Energy efficiency assessment. Competence of a lead energy assessor. Specification”, which at £70 seems quite good value until you read it.

Swap your shopping basket for a trolley now, because we’re going to think about measuring and verifying our savings. To set the scene, let’s fork out £212 on EN 16212 “Energy Efficiency and Savings Calculation, Top-down and Bottom-up Methods”. Please suppress the thought that probably crept into your mind on seeing the words “up” and “bottom” in the title of one of these worthy publications, especially as we will see them again when we splash out £146 on CWA 15693 “Saving lifetimes of energy efficiency improvement measures in bottom-up calculations”.  Then to be on the safe side let’s get ISO 50015 “Energy management systems. Measurement and verification of energy performance of organizations. General principles and guidance” at £152, plus ISO 50006 “Energy management systems. Measuring energy performance using energy baselines and energy performance indicators. General principles and guidance”  (£174). Nearly done… To make sure that our efforts to comply with all this stuff are up to scratch, let’s round off with £146 for ISO 50003 “Energy management systems. Requirements for bodies providing audit and certification of energy management systems”.

All in all, the bill could be over £2,000. There is no truth in the rumour that the International Standards Organisation, British Standards, and the Comité Européen de Normalisation are contemplating a joint venture to be called “ISO, BS and CEN Enterprises” or ISOBSCENE.

Choosing an assessment interval

By default, I tend to favour a weekly assessment interval for routine exception reporting and associated analysis. Monthly is too long for all except the smallest users (although it may be appropriate for passive top-management reports for users of all sizes) and months are also too inconsistent in terms both both of duration and number of working days.

In some applications, daily analysis may be viable, for example:

  • in buildings such as data centres which operate seven days a week and respond rapidly to changing weather conditions; or
  • in energy-intensive manufacturing processes.

More frequent near-real-time assessment is sometimes attempted but this brings complications that tend to outweigh the benefits. Firstly, there will be error induced by short-term effects such as transients, lags, latencies, and factors which are not practical to take into account but whose random influences would have cancelled out over a longer time interval. Secondly, the cash values of excess consumptions over a short interval are very small. Thus with too-frequent reporting the user is continually bombarded with trivial alerts which often prove fleeting. Not the best recipe for engagement.

Having said that, where fine-grained data are being collected they can be an invaluable diagnostic aid; but the best reporting tactic is to review performance at, say, a daily or weekly interval and use the real-time record for diagnosis by exception.


How to waste energy No. 9: energy audits

For the keen energy waster faced with demands to have an energy audit, it is vital to employ an incompetent assessor — one who can be expected to follow these principles:

1. Just turn up at site with a clipboard and start counting light fittings.

2. Never analyse historical data to identify anomalies that you could productively focus on during site visits.

3. Base your report on a previous one for a different client. A good trick is to use ‘find and replace’ to change the name in the body of the text, but overlook where it appears in headers and footers.

4. Always make at least ten recommendations, even if there is only one substantial worthwhile measure.

5. Always include recommendations for LED lighting and voltage reduction.

6. Over-estimate the savings expected from each recommendation.

7. Ignore any possibility of interactions between recommended measures.

8. Never obtain actual installation costs. Reverse-engineer them: take the annual savings and multiply by an assumed payback period.

Of course as a client, the keen energy waster has their own part to play in making the audit a futile exercise. Here are some tips:

1. Do not let anybody in the organization know about the audit visit.

2. Render all relevant data and drawings inaccessible.

3. When you receive the report, ignore it.

How to waste energy No. 8: road transport

Transport in all its forms provides excellent opportunities to waste energy. Here are a few related to car, van and truck use:

1. Never arrange a telephone call or video conference if you can drive to a meeting instead. Driving long hours shows you are working hard.

2. Never share a car journey.

3. Make sure drivers have not got clear directions to their destinations, so that they get lost.

4. Use oversized goods vehicles whenever possible, and avoid consolidating loads to improve load factor.

5. Do not plan freight movements. For example if back-loads are available, it is better to send out empty vehicles to fetch them.

6. Never optimize multi-drop delivery routes.

7. Never give drivers training. Encourage them to accelerate hard, drive too fast in too low a gear, brake harshly, and idle their engines for long periods.

8. Fit the wrong kinds of tyres and run them at the wrong pressures.

9. Neglect maintenance of tracking and brakes: as well as wasting fuel you can spend extra on tyres and brake parts.

10. Do not monitor mileages, loadings or fuel purchases.

How to waste energy No. 7: meter reading

A big part of wasting energy is not knowing how much you use, when, where or for what. Most keen energy wasters rely on their energy suppliers not read their meters for them, but here are some top tips for those who want to be proactively bad:

1. Make it difficult to get access, for example by installing meters at height, or leaving the keys to the meter room with an obnoxious jobsworth.

2. Try to have meters installed in positions where you cannot see their dials.

3. Never have a reliable check-reading taken by somebody who knows what they are doing.

4. Do not create a meter schedule; if you have one, don’t keep it up to date.

5. Do not try to find out what each meter serves.

6. If in doubt about units of measurement or scale multiplier factors, make whatever assumptions you like.

7. When a meter is swapped out, dispose of the old one without noting its final reading.

8. Do not train anybody to read meters.

9. Do not appoint stand-ins to cover for sickness or holiday absence.

10. Allow meter readers to be lax about when they take readings, and let them record the date they were supposed to take the readings rather than the actual date and time.

11. Allow meter readers to include or ignore decimal fractions as they feel inclined, if possible being inconsistent between visits to the same meter.

12. Rely on paper returns, and lose them.

Link: Energy management training


How to waste energy No. 6: air conditioning

The hot weather brings with it demands for air conditioning, and with that comes a whole raft of excellent ways for organizations to waste energy. Here are my top ten hot tips:

1. Don’t argue when people ask for rooms to be cooled to 20C rather than the more sensible 27C. Every degree reduction in set-point adds 10-15% to the electricity used for cooling, and you may even hit the jackpot of some people turning on electric heaters as well.

2. Encourage people to leave the windows open with the air-conditioning on. This allows warm air in and expensively-cooled air out, more or less guaranteeing that the air conditioning will have to run flat out without reaching the desired internal temperature.

3. If it is not possible to leave the windows or doors open, minimise the recirculation of ventilation air.

4. Do not take advantage of lower overnight outdoor temperatures to pre-cool occupied spaces.

5. Encourage people to leave idle electrical items running, to increase the heat gains. Desk fans are an excellent example for those who can appreciate the irony: by creating air movement they make the occupants feel more comfortable, while continuously heating the air a little.

6. Believe your IT department and equipment suppliers when they say their kit needs to be housed at 16C (the idea that it might be designed to operate in tropical climates is ridiculous).

7. In computer rooms have the equipment racks all in the same space, so that their warm extract air mixes with the chilled air needed for intakes. Under no circumstances partition the space to separate cold and warm air.

8. If possible, house people and equipment racks in the same space as if they needed and/or could tolerate the same conditions.

9. Do not shield windows from direct sunlight.

10. Always use artificial cooling when increasing the ambient fresh air supply would do the job equally well.

Energy management training