Normally when we track vehicle performance we think in terms of miles per gallon or kilometres per litre. So in figure 1 for example we are looking at the weekly km/litre figure for a 32-tonne flatbed lorry delivering building materials:
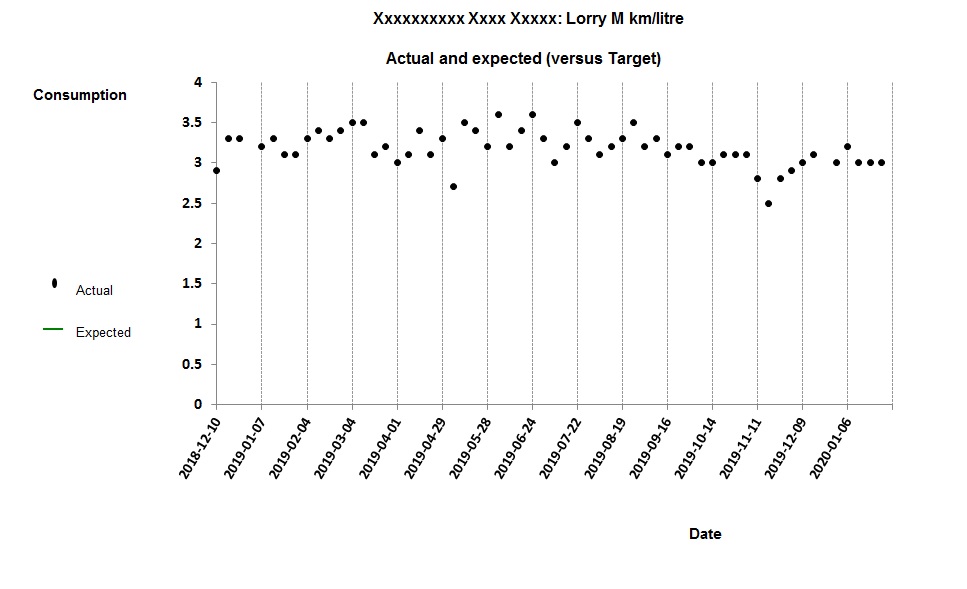
It is just about possible to discern worsening performance towards the end of the trace. But by taking a slightly different approach we can not only confirm that there is an issue, but also learn more about its timing, nature and magnitude. We should start by plotting weekly fuel consumption against weekly distance traveled as in Figure 2. (Distance traveled is the “driving factor” in this analysis not in the sense of driving the lorry, but in the sense that variation in weekly distance traveled “drives” variation in weekly fuel use):
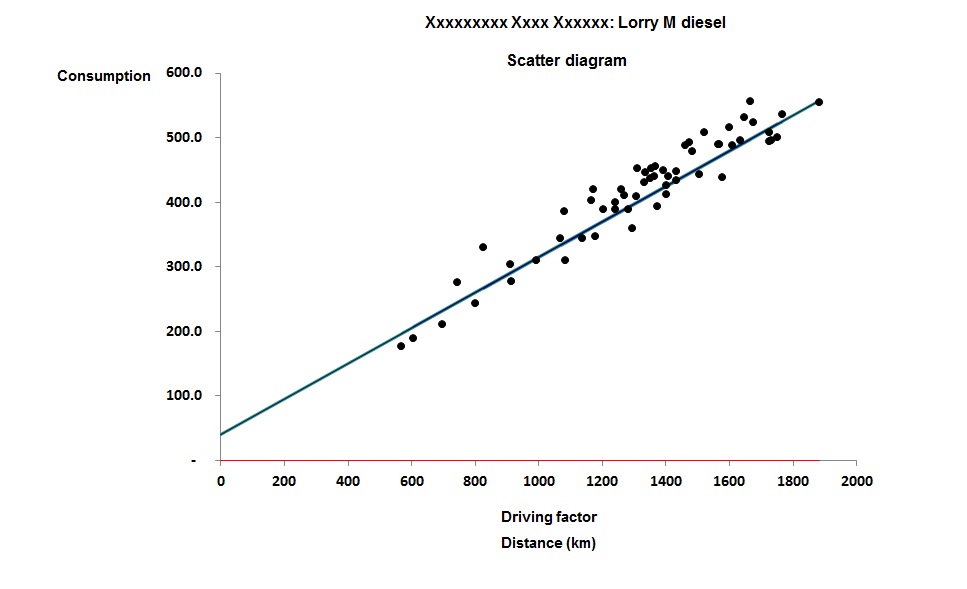
What we see is that there is an element of consumption (about 40 litres per week in this case) that is unrelated to distance driven. Most likely, this is fuel consumed while stationary. The straight-line relationship gives us a more precise gauge of performance because it allows us to deduce expected consumption each week quite accurately. We can thus show the deviation from expected fuel consumption as a time-history chart (Figure 3):
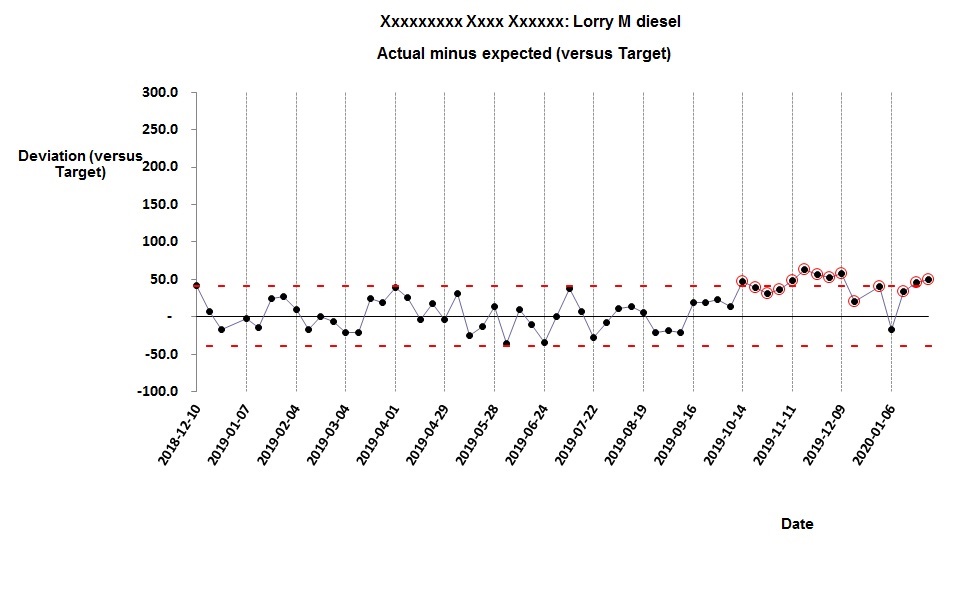
From this it is clear that there was a change in behaviour on or about 7 October, which manifests itself as a fairly consistent 50-litre-per week excess almost every week since (see the highlighted points).
Furthermore, we can compare the adverse and achievable behaviour on the scatter diagram (Figure 4) in which the post-change points are marked:
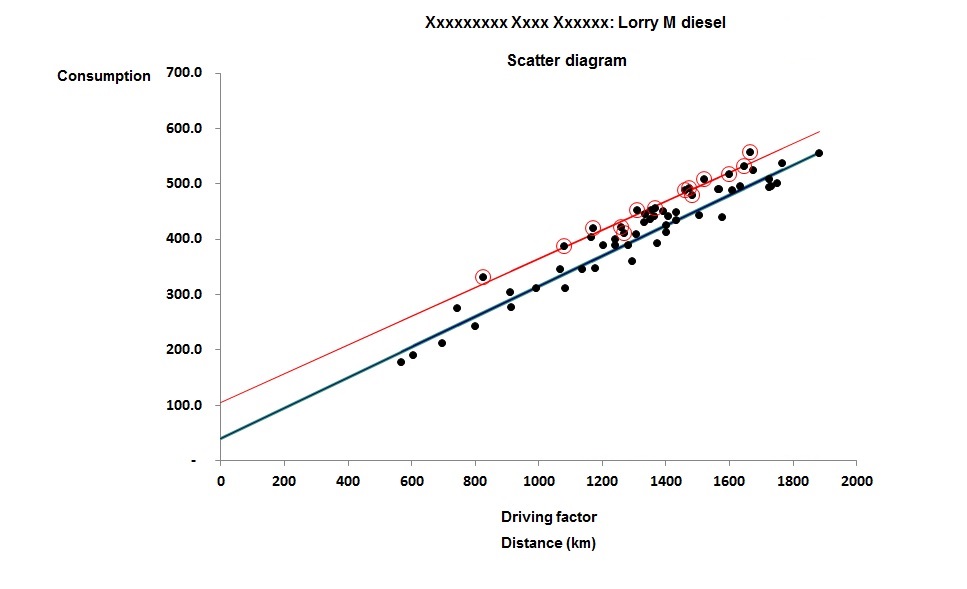
The red straight line is a best fit through all the post-change points, and it shows us that the apparent excess fuel consumption is not distance-related. It might be a permanent change in terrain or traffic conditions or a new pattern of deliveries with more waiting time… Or it might be a new driver who doesn’t turn their engine off while waiting. It probably isn’t a mechanical fault, because that would tend to change the gradient of the line. But at least we know when the change occurred (which will help trace the cause), its nature (which helps eliminate some kinds of fault) and its magnitude (which helps us decide whether to bother pursuing the case).
Try getting those insights from tracking the MPG.
This method of monitoring energy performance also applies to buildings and industrial processes, and you can find training on the method at http://vesma.com/training