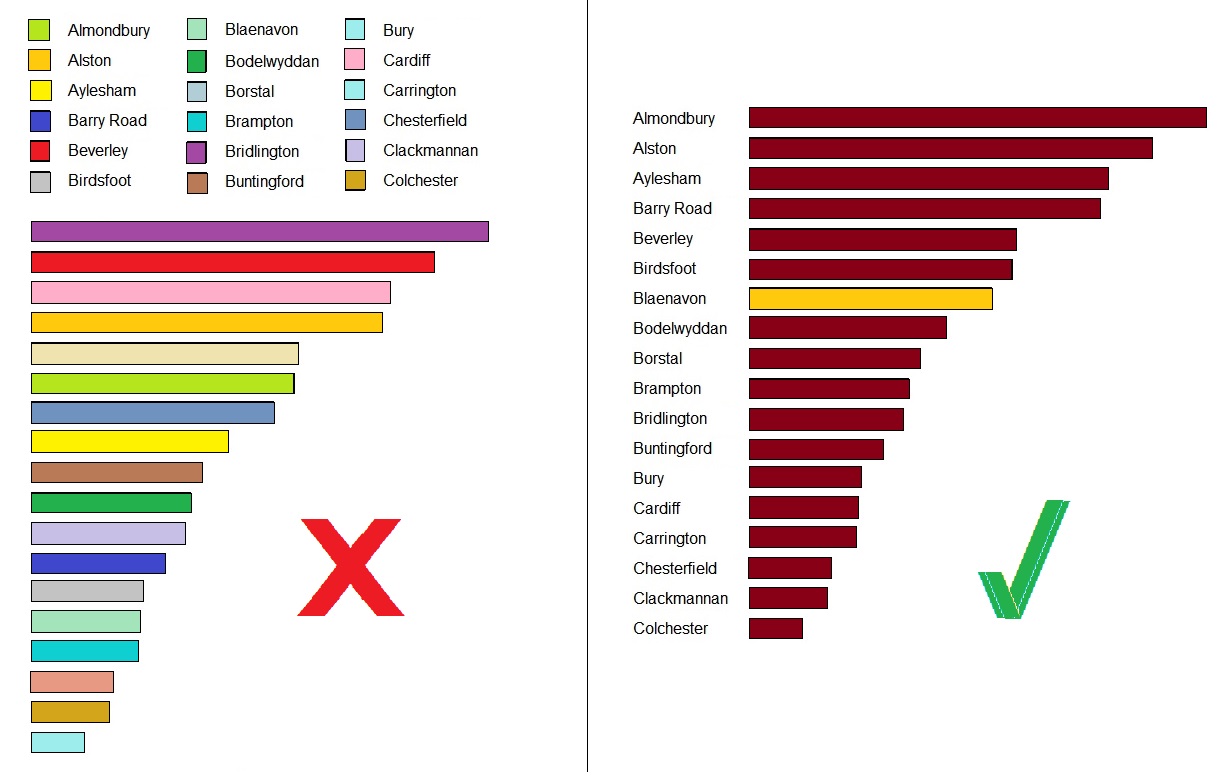
The chart format on the left is a reconstruction of something I saw in an energy reporting system based on a generic platform who shall remain nameless (you know who you are). It is being used here to represent the relative total energy consumptions of a number of establishments. Although admittedly it is better than a pie chart, it is still one of the least user-friendly designs I have ever seen. The person who devised it should be ashamed of themselves.
Why have remote labels with a colour-coded key, when the labels could just be put alongside the bars they relate to as shown on the right-hand example? Especially as with so many entries the colours are hard to discriminate even for a user with perfect colour vision.
The right-hand version of the chart gives the identical information perfectly clearly with bars of the same colour, the additional advantage being that, if required, one specific item can be highlighted in a contrasting shade as shown. Oh, and it won’t matter if your computer monitor’s colour rendering is a bit off.