THE ANALYSIS TECHNIQUES that underpin energy monitoring and targeting have important applications in the search for energy-saving opportunities. A good energy audit doesn’t start with a checklist and a clipboard: it starts with some desktop analysis. Here’s how…
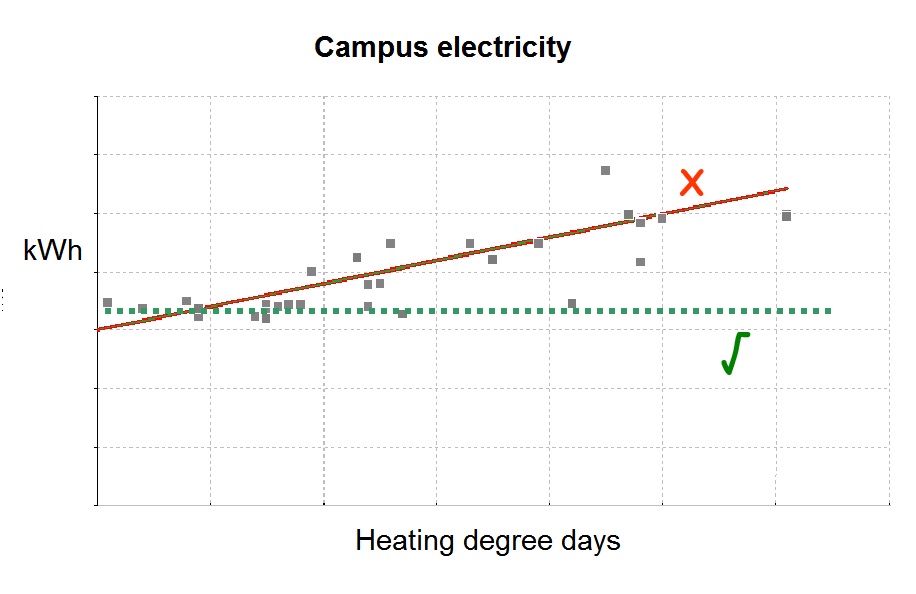
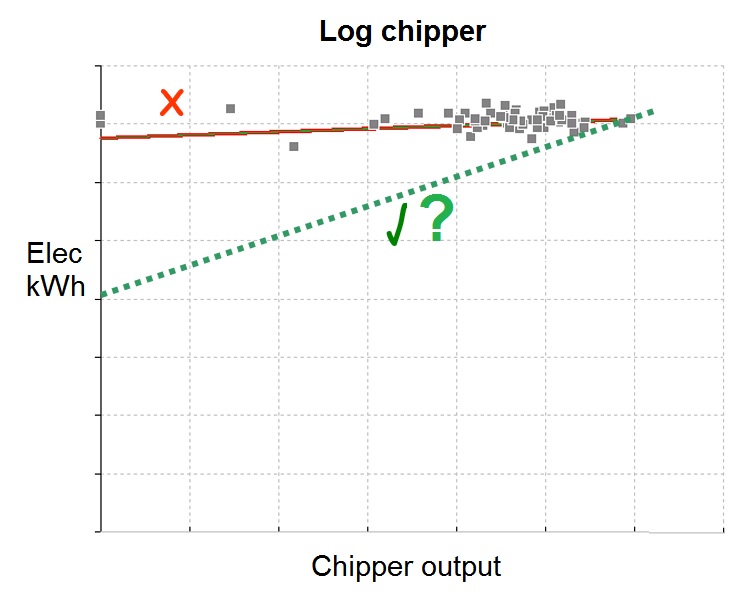
Regression analysis, in which we establish the historical relationship between consumption and its driving factor(s), can give us clues if we see anomalous patterns. Does consumption appear to be weather-related when it shouldn’t be, as in Figure 1? Does it fail to respond to production throughput (as in Figure 2) when logically it ought to vary? Do we seem to have unreasonable levels of fixed consumption?
Regression analysis also enables ‘parametric’ benchmarking which is a simple but more effective variation on the theme (see separate article).
Cusum analysis meanwhile shows us whether past performance has been consistent, and if not, when it changed plus (when combined with regression analysis) in what manner. Did we add (or lose) some fixed demand? Or did sensitivity to a driving factor change? (Read more about cusum here).
Next, the concept of expected consumption enables the computation of ‘performance deficit’, meaning the absolute quantity of energy that we are using in excess of achievable minimum requirements. When translated into cost terms this gives us a clear view of where our most valuable opportunities lie (read more about performance deficit here).
And finally we could add visualisation of fine-grained consumption patterns. But that is costly. Everything else can be done with information collected at weekly intervals.
For training on energy analysis follow this link