When monitoring consumption in outside lighting circuits with photocell control, it is reasonable to expect weekly consumption to vary according to how many hours of darkness there were. And that’s exactly what we can see here in this Spanish car park: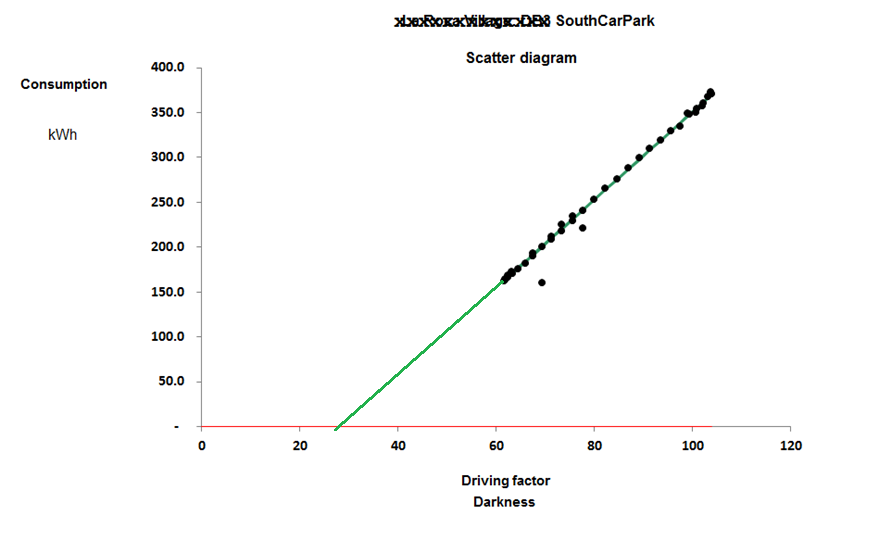
It is a textbook example: with the exception of two weeks, it shows the tighest correlation that I have ever seen in any energy-consuming system.
The negative intercept is interesting, and a glance at the daily demand profile (viewed as a heatmap) shows how it comes about: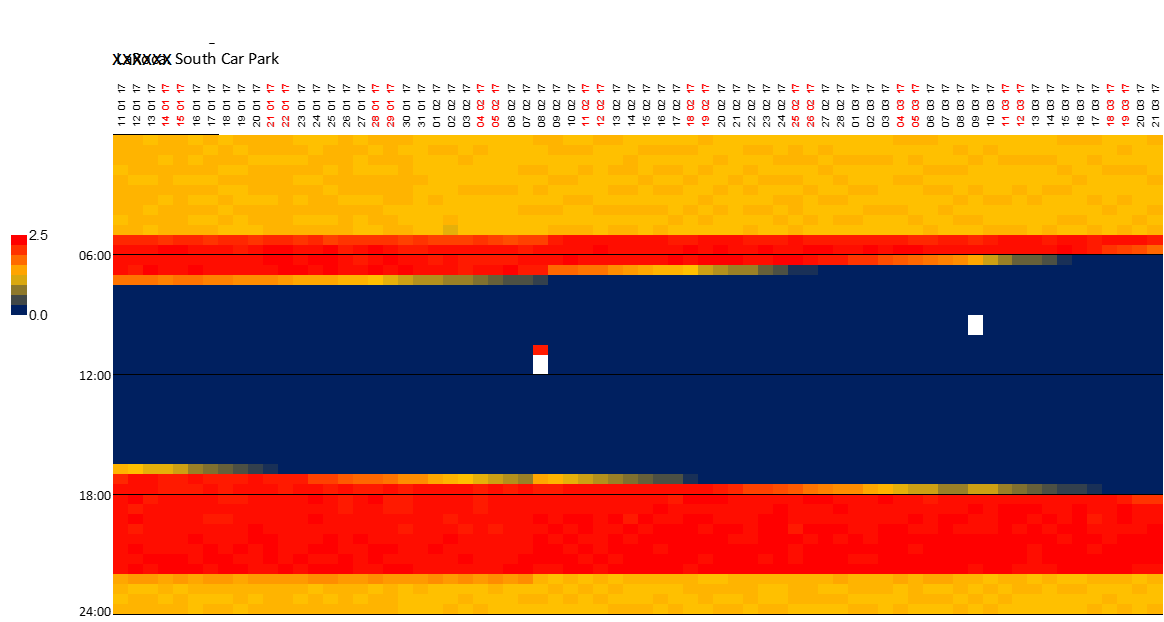
Moving left to right we see from January to March the duration of daylight (zero consumption in blue) increases. High consumption starts at dusk and finishes at dawn, but from about 10 p.m. to 5 a.m. it drops back to a low level. It is this “missing” consumption for about seven hours in the night which creates the negative intercept. If they kept all the lights on from dusk to dawn the line would go through the origin.
For weekly and monthly tabulations of hours of darkness (suitable for England and other countries on similar latitudes) click here.