DATELINE 1 APRIL, 2023: At our last transport energy course the closing discussion took an interesting turn when a delegate raised the question of energy conservation in fishing fleets. After the course I dived in and did a bit of research on the net. I was soon hooked. One company, Dover Solar, proposes electric trawlers towing PV arrays. Another outfit, Energy Fish-in-Sea, has floated the idea of towing sonic emitters to drive the fish forwards. They have yet to demonstrate it at scale and I wonder whether there would be a catch; it could flounder. Could the UK make its fishing fleet net zero? I’ll leave you to mullet over.
All posts by Editor
Net and gross calorific values
In the UK when estimating fleet energy consumption from vehicle mileages, we may choose to use the tables published in official guidance (extract illustrated below) which convert distances in miles or kilometres to kWh consumptions for different classes of vehicle.
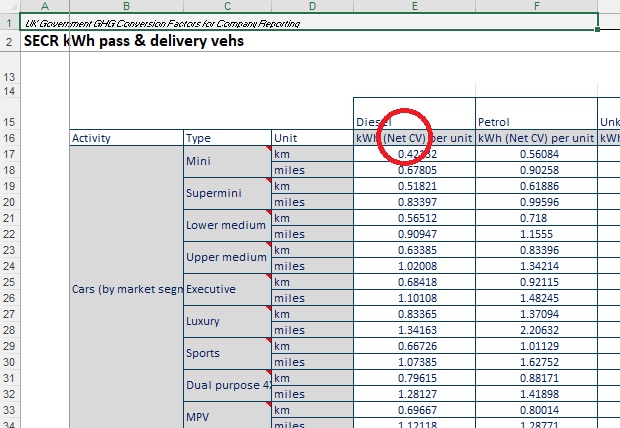
As indicated in Figure 1, the conversion factors are stated on a net calorific value (NCV) basis. However, this is not compatible with the way we normally account for energy in the UK. We actually use gross calorific values (natural gas, which of course is our predominant fuel for static applications, is billed on a GCV basis). For consistency we should account for transport fuels on a GCV basis as well.
What difference does it make? A fuel’s gross calorific value is a measure of its total energy content, whereas NCV ignores that fraction of energy which will be lost as latent heat in water vapour in the exhaust. The higher the hydrogen content of a fuel, the greater the discrepancy. Forecourt diesel’s GCV is 6.3% higher than its NCV; for natural gas the difference is 10.8%.
To convert kWh quantities based on NCV to their GCV equivalent you need to multiply by the following factors:
Aviation Spirit 1.053
Aviation Turbine Fuel 1.053
Burning Oil 1.053
Butane 1.084
Coal (domestic) 1.053
Coal (electricity generation) 1.053
Coal (electricity generation – home produced coal only) 1.053
Coal (industrial) 1.053
Coking Coal 1.053
Diesel (100% mineral diesel) 1.064
Diesel (average biofuel blend) 1.063
Fuel Oil 1.064
Gas Oil 1.064
Lubricants 1.064
LPG 1.074
Naphtha 1.053
Natural Gas 1.108
Natural Gas (100% mineral blend) 1.108
Other petroleum gas 1.087
Petroleum coke 1.053
Petrol (100% mineral petrol) 1.053
Petrol (average biofuel blend) 1.055
Propane 1.086
Waste oils 1.071
Discounted cash flow
HOW SHOULD energy-saving investment opportunities be evaluated? I recommend discounted cash-flow (DCF) rather than the commonplace, but somewhat crude, metric of simple payback period. DCF will give you two measures of a project’s value:
- Internal rate of return (IRR) is the rate of interest you’d need to get from investing your cash in something else, to make that the more profitable choice; and
- Net present value (NPV) shows you what lump sum today would equal the lifetime profit from the project, assuming that you place relatively less weight on future savings the further off they are.
To carry out a DCF calculation for an energy-saving project you start with year-by-year estimates of costs and savings. In the simplest model there is a single cost item in the first year and equal annual savings thereafter; but with some projects there will be costs in future years, or the savings may be predicted to vary in future. The screenshot below shows an annotated example in an Excel spreadsheet. It evaluates a heat-recovery system which, as well as an up-front investment cost, will incur annual electricity costs and maintenance charges (all outgoings being shown in red):
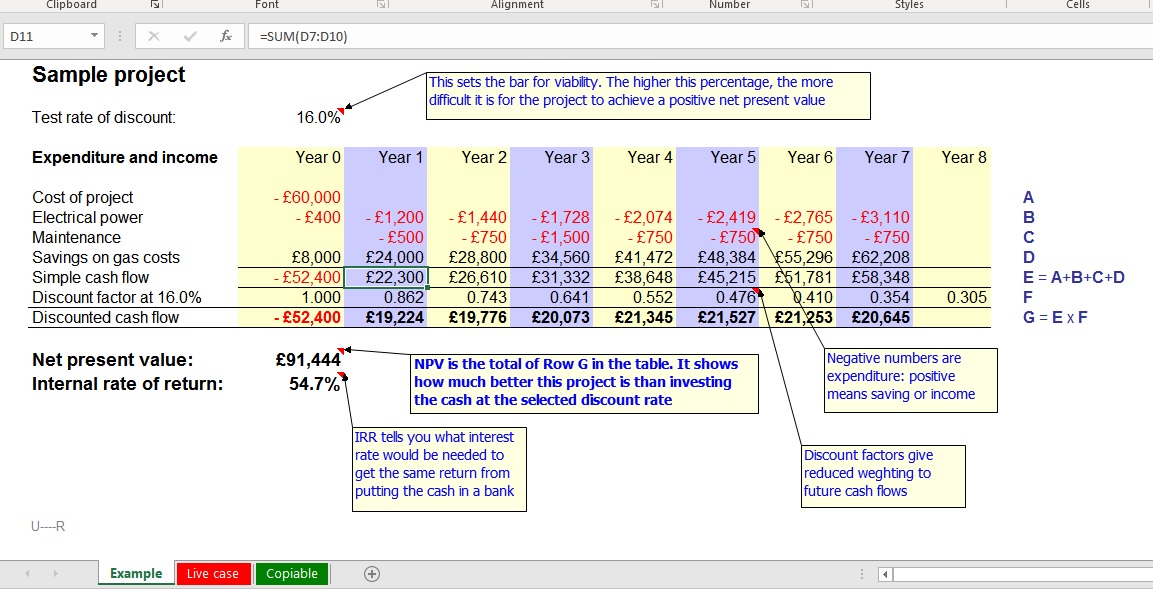
The IRR in this example is 54.7%.
The NPV depends on what you choose as a ‘test rate of discount’. In theory this would be the interest you pay on borrowings, although in practice it is often set a lot higher as a hedge against perceived risk. The example above uses 16% and you can see in row F the discount factors that result. In Year 3 the factor is 0.641, meaning that the savings of £31,332 expected that year are only worth £20,073 in today’s terms. In aggregate the NPV is £91,444. That’s how much better off you would be than the option of doing nothing.
Note that with a lower test rate of discount, the discount factors in row F increase, which raises the net present value.
A DCF workbook is available to download here. It includes the annotated example shown above, a live calculation that you can use for experimentation and familiarisation, and an unlocked version which you can copy and adapt.
‘Average’ and ‘Standard’ degree day figures
EFFECTIVE MANAGEMENT AND ANALYSIS of buildings’ energy consumptions for heating or cooling calls for summary data about how cold or hot the weather has been. Weekly or monthly degree-day statistics provide that information in a convenient manner. But as well as the current values (against which your weekly or monthly energy consumption can be gauged), in the United Kingdom[1] we have two kinds of long-term aggregate value that can be useful for other purposes.
Standard degree-day values
For normalising consumptions we need degree-day values for a ‘reference year’, which allow actual consumptions for buildings in different locations (and possibly measured at different times) to be adjusted back to a comparable basis. Historically, the UK government recommended a standard value of 2,463 heating degree days (to base 15.5C). The source of this number is unknown; it is, in effect, arbitrary but for the purpose of weather-adjustment it does not matter what the number is. This single point of reference was later developed into the following table providing corresponding reference values for different base temperatures, for cooling as well as heating, and disaggregated to individual months:
|     |        Heating       |       Cooling        |
|Month| 18.5'C 15.5'C 10.0'C | 15.5'C 5.0'C -20.0'C |
|     |                      |                      |
| Jan |    488    395    226 |      0    17     705 |
| Feb |    426    342    189 |      0    23     652 |
| Mar |    390    297    134 |      0    64     803 |
| Apr |    319    233     96 |      5   114     837 |
| May |    235    151     39 |     14   192     963 |
| Jun |    148     77      9 |     26   265    1015 |
| Jul |     88     42      4 |     96   380    1155 |
| Aug |    100     45      5 |     57   338    1113 |
| Sep |    162     83     10 |     14   245     995 |
| Oct |    268    177     48 |      1   158     925 |
| Nov |    359    275    124 |      0    53     719 |
| Dec |    439    346    176 |      0    29     755 |
|     |                      |                      |
|Total|  3,422  2,463  1,060 |    213 1,878  10,637 |
Table 1: standard degree day values
It is important to appreciate that these standard values are fixed and not related to any particular geographical area.
Average degree-day values
If we are forecasting consumption we need to know what future degree-day values we can expect month by month. For this purpose we use 20-year average degree-day values. So the expected degree-day value for next February (for example) is the average of the last 20 Februaries. You can download the UK regional average figures via this link.
In contrast to ‘standard’ degree-day values, ‘average’ values differ from region to region and tend to vary with time thanks to the changing climate. I usually update the table once a year.
—
[1] Subject to the availability of suitable historical data, the same principles could be applied in other regions.
Keeping a sense of proportion
This web site doesn’t usually cover domestic energy saving but the topic is of indirect relevance when one is conducting staff energy awareness training. Learning about how to cut energy costs at home is one of the benefits to staff of participating in such programmes.
At the time of writing (October 2022) UK energy prices are increasing dramatically and the media (as ever in such circumstances) are awash with energy-saving tips, many of which are trivial or patronising. As part of any awareness-raising programme it could be useful to steer people away from irrelevant time-wasting ideas and towards things that will actually make a difference. In this article I’ll put some numbers to some of the advice that’s currently doing the rounds. These are rough-and-ready estimates based on a lot of simplifying assumptions and the prices I will use are £0.15 per kWh for gas and £0.52 per kWh for electricity.
Tip no. 1: when cooking, avoid opening the oven door to inspect the contents
The argument presented here is that the hot air will escape and more energy will need to be put in to compensate. Let’s look at that: the capacity of the oven will be of the order of 60 litres. Let’s say all the air in the oven is replaced with room air. 60 litres of room-temperature air will have a mass of 0.07 kg. With a specific heat of near enough 1 kJ.kgK, and supposing a temperature rise of (say) 180 degrees, that implies 0.07 x 1 x 180 = 12.6 kJ = 0.003 kWh, or 0.2 pence wasted. Verdict: bonkers.
To put that in perspective, it’s the equivalent of preheating the oven for 4 seconds longer than needed. But even preheating the oven prematurely isn’t a huge deal. Once up to temperature it will very likely dissipate something of the order of one kilowatt (costing 52p per hour) so ten minutes idle costs only about 9p.
Tip no. 2: don’t boil more water than you need
Suppose you boil 0.5 litre more water than you need. With a specific heat of 4.2 kJ/kgK and assuming cold supply at 10°C, the extra heat supplied is 0.5 x 4.2 x (100-10) = 189 kJ = 0.05 kWh or 2.6 pence worth. Verdict: trivial.
Tip no. 3: use a shower rather than a bath
Let’s look first at the cost of a bath using gas-fired hot water. I’ll assume 100 litre (kg) cold feed at 10°C and bathwater heated to 45°C. At a specific heat of 4.2 kJ/kgK that needs 100 x 4.2 x (45-10) = 14,700 kJ of net heat. Assuming 80% boiler efficiency that equates to 18,375 kJ gross , i.e. 5.1 kWh or say 77 pence.
Contrast that with 10 minutes in an 11kW electric shower: that’s 11 x 10/60 = 1.8 kWh, costing 94 pence, a bit more than the bath. To name a saving you’d need to limit yourself to 8 minutes in the shower. Verdict: marginal
What about a shower fed from the gas heating? Suppose it’s a combi boiler with 16 kW water-heating capacity operating at 80% efficiency (ie 20 kW input) again for ten minutes. That would use 20 x 10/60 = 3.3 kWh of gas, costing 50 pence (27 pence less than the bath). Verdict: unexciting
Tip no. 4: turn off unwanted lights
Let’s take for our example an LED lamp rated at 10 watt. That will cost about 3 pence per hour to run but unlike ovens, kettles and baths, one tends to have a lot of them and use them continually so their cumulative effect in a household could be relatively costly. Eight such lamps run on a daily basis for four hours more than needed would add 8 x 4 x 10 x 365 = 116.8 kWh per year, costing an extra £61 per year. Verdict: do it
The energy-conscious organisation
In 2019 I was involved in the “Energy Conscious Organisation” initiative promoted by the Energy Services and Technology Association. This programme is about behaviour change not in the normal sense (something which organisations promote on the shop floor) but fostering a more holistic approach, bringing in the design and procurement of assets, for example, or addressing maintenance policies. It amounts to organisational culture change drawing in management and professional functions. I think an “Energy Conscious Organisation” could be characterised as follows. It minimises its use of fuel and electricity by…
- Engaging and involving everyone at all levels and in all functions;
- Encouraging vigilance, facilitating resolution of problems and exploiting opportunities;
- Developing individuals’ skills and knowledge as needed;
- Adapting its policies and processes to guarantee continual improvement;
- Measuring, monitoring and reporting the results
For brevity we could reduce this to five watchwords: Vigilance—Engagement—Skills—Monitoring—Adaptation. If only that had a memorable acronym.
Air-con bolt-on
Bulletin reader Adam F. is plagued by emails from a company selling a bolt-on thermostatic control for split-system air conditioning units. They claim ‘up to 40%’ savings. Is this plausible?
Now the rate of heat flow into an air-conditioned space is proportional to the outside-inside temperature difference (barring changes in ventilation rate and ignoring solar gain, which I will come back to). Let’s suppose you are maintaining 18°C indoors: the rate of heat inflow when it’s 28°C outside will be double what it is when it is 23°C (a ten-degree differential compared with a five-degree differential).
To maintain steady internal conditions the heat inflow must be balanced by an equal amount of cooling. There are two ways to reduce the energy used for cooling:
- reduce the rate of heat inflow; or
- improve efficiency or reduce losses in the refrigeration plant which provides the cooling
Solutions based on improved thermostatic control address the first option, and they claim to do so by preventing overshoot whereby the evaporator (indoor unit) continues to cool the space after the set point has been reached and it has turned off. The effect of such overshoot, if it occurs, will be to depress the internal temperature slightly. The heat flow into the space will accordingly increase slightly, balancing the excess cooling that has been supplied. But how significant will the effect be? Ultimately it depends on the impact on average internal temperature over time. Remember that the overshoot will be transitory, but let’s be pessimistic and suppose that it gives an average space temperature that is 0.2°C lower than it need be. With an outside-inside differential of 5 degrees, that would imply only 4% excess heat flow and corresponding cooling load. But this is 4% of quite a low load; if the system were sized for a 20-degree differential a 0.2°C offset in space temperature would be adding only 1% to the load when running at design conditions.
But there is a twist. Overshoot can only occur as the thermostatic control commands the cooling to turn off. This may be quite frequent at low loads, but becomes less so as the load increases and the cooling spends a greater proportion of its time running. So the hotter the weather and the harder the cooling has to work, the less waste there will be in absolute terms, and this smaller absolute waste becomes an infinitesimal percentage of the higher demand. Solar gain, when it occurs, increases the load on the cooling system, which reduces the number of start-stop cycles by lengthening the ‘on’ periods and hence cuts down the opportunities for thermostatic overshoot.
The final thing to bear in mind is that although we have, in this analysis, a range of potential savings from maybe 4% at low load to essentially nil at full load, not much consumption occurs at low load so the potential year-round savings are skewed well away from the 4% figure.
My verdict: plausible savings might be of the order of 1% but only if thermostatic overshoot actually occurs.
Blowing your profits
The ‘Star Spot’ award for June 2022 went to a consultant who spotted completely avoidable waste of compressed air in a factory. Compressed-air systems are both costly to run and prone to hidden losses, so it pays to do what our reader did, namely a walk-round check with his client while the factory was shut for the weekend. They suspected a serious problem because outside working hours there were enough leaks to keep one compressor running almost continuously. As they walked around they found the odd poor joint but when they went outside there was quite a significant hissing from one of the factory’s dust collectors.In this installation the life of the filter bags was prolonged by timed short pulses of compressed air inside the individual bag in order to blow or knock the dust off of the outside of the filter. Unfortunately one of the air lines had become detached upstream of the solenoid valve and was continuously discharging compressed air. With this fixed, the load on the duty air compressor dropped dramatically.
Remember also that all the time the air line was disconnected, the filter bag wasn’t ever being back-flushed: another perfect example of how energy waste often goes hand in hand with loss of service.
Incidentally, it would have been possible to improvise a measurement of the compressed-air savings quite simply. During a period of no demand, you can shut off the compressors and time how long it takes the pressure of the stored air to drop by one bar. Knowing the volume of receivers on the system allows you to compute the rate of air loss. When the pressure drops by one bar, you have lost the receivers’ volume of free air. So for example if you have a 690-litre receiver and it drops from 7 to 6 bar in 30 minutes, the air loss rate is 690/30 litres per minute or the equivalent of over 12,000 cubic metres per year on a continuously-running system. As an efficient compressor takes about 0.1 kWh per m3 of air compressed, that would be wasting 1,200 kWh per year. Repeating the test after attending to leaks would show you how much you had saved; repeating it periodically allows you to monitor for deterioration.
Savings in electric motors
Bulletin reader Matt contacted me after seeing a presentation on replacement electric motors. The sales person claimed they could save 50% energy on a like-for-like replacement of an IE3 motor. Matt quite correctly challenged them to explain how they could save 50% on a motor that’s 90%+ efficient, and of course they could not give a scientific answer.
They might have meant that their motor technology halved the losses in the motor, taking it from say 90% to 95% efficient. But that would result in about 5.3% saving, not 50%. The only way to reduce the energy consumption of a motor by an order of magnitude is to reduce how much work it does. Actually that is entirely possible; it’s what variable-speed control does. On centrifugal fans, for example, a 20% speed reduction almost halves the mechanical power absorbed by the fan and that, thanks to the principle of an energy balance, translates into a corresponding reduction of the power delivered by its motor and hence the power that the motor draws from the mains. So maybe the vendor was not talking about a like-for-like replacement but the replacement of fixed-speed with variable-speed motors. In which case speed-control on the existing motors could be considered as an option.
Anyway, speed control would be one way that the vendor might have achieved their 50% savings. But that would be savings on motor power alone, while their web site trumpets 40-60% savings ‘overall’ on heating, ventilation and air conditioning systems. Also not completely impossible, but (again invoking the principle of an energy balance) it implies that the building’s demand for heating or cooling was reduced by that much. However, short of using the fan-speed control aggressively to cut back the ventilation rate drastically, it is hard to see how that could be achieved.
Fridge and freezer doors
It has always been a staple of energy training related to catering that the doors of fridges and freezers should have tight seals and effective closers, and that walk-in freezers should have insulated strip curtains to supplement the proper door when it needs to be kept open temporarily. Most of us would assume that this advice relates to preventing the ingress of ambient air, but that’s not the whole story. When room air gets into a freezer, something like a quarter of the energy needed to cool it down goes into condensing and then freezing the water vapour it was carrying. The amounts involved are not huge: something like 0.02 kWh per cubic metre of air overall. What is significant is that the internal vapour pressure will plunge. So even after the door is closed, ambient moisture will pour in through any gaps in door seals, adding continuous cooling load as the condense-freeze process continues. Meanwhile the resulting ice build-up will be clobbering the energy performance.
It’s atmospheric moisture that you need to keep out.