Background
This story concerns a commercial data centre, and specifically its cooling system. The players are: (a) clients whose servers are housed in the centre; (b) a facilities operations team responsible for maintaining conditions in the server hall; and (c) a sustainability manager whose duty is to ensure that energy consumption is minimised. There is a service level agreement in place and the facilities team are contractually obliged to report regularly on the server-room temperature.
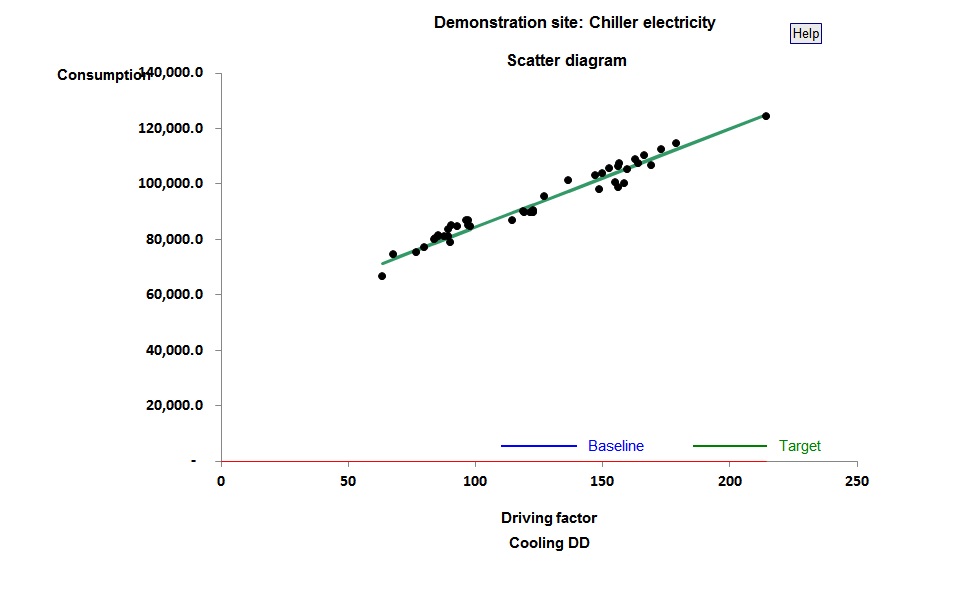
The sustainability manager regularly reviews consumption against weather-related targets, in order to detect excessive consumption. Specifically he uses the relationship between chiller electricity consumption and cooling degree days, as illustrated in Figure 1:
The story
At the end of September 2020, weekly consumption began to deviate from expected values. The first few weeks of abnormal performance are highlighted in Figure 2:
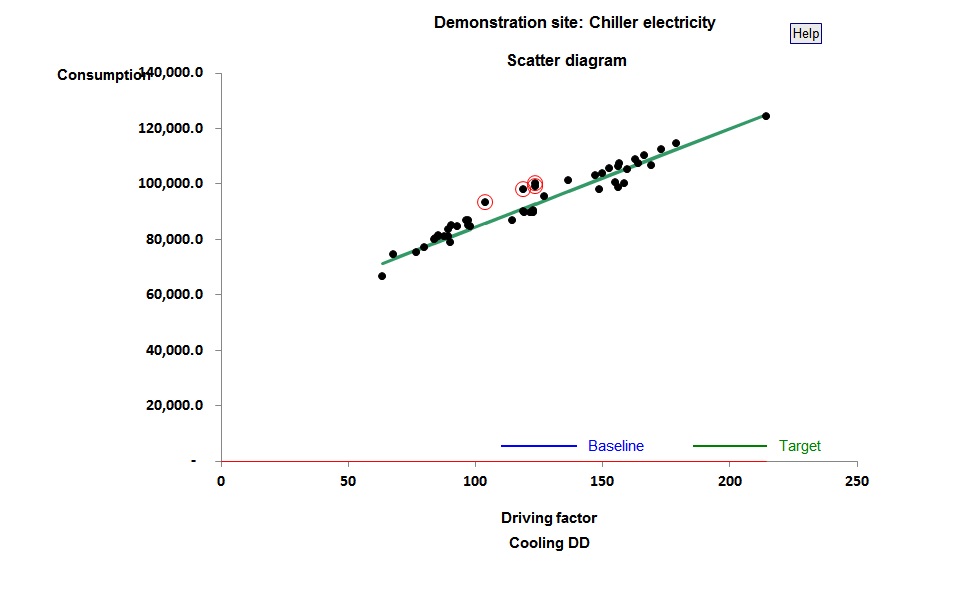
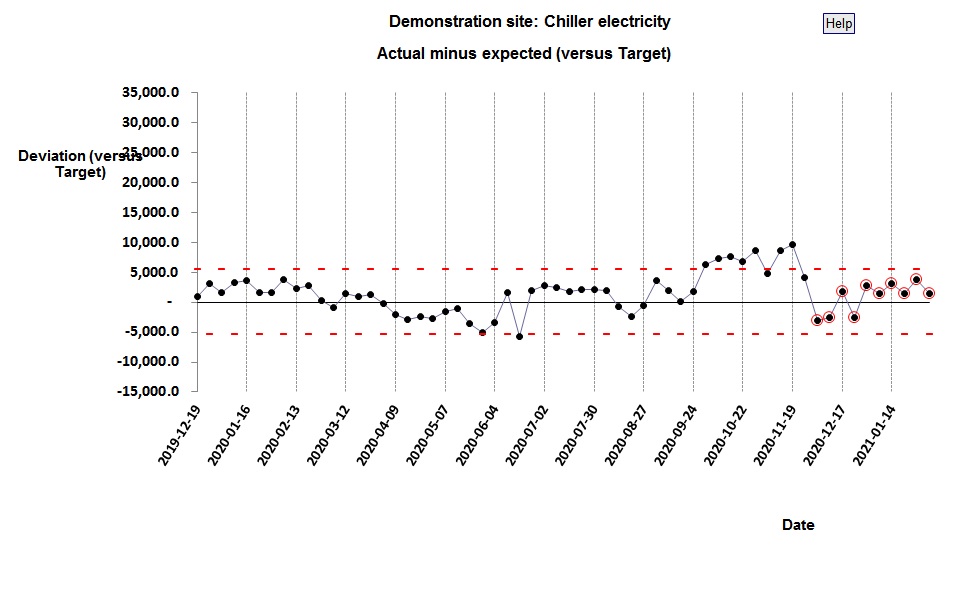
Figure 3 is a control chart which shows that the deviation is not only statistically significant compared with anything previously observed, but it’s also persistent:
At this point the sustainability manager challenged the operations team for an explanation. The problem turned out to be the location of the temperature sensor that was used for their routine service-level reports. It was not registering the actual air temperature at equipment level, but a higher value. To get around this problem the ops team had started overcooling the building to ensure that their temperature reports were within the specification.
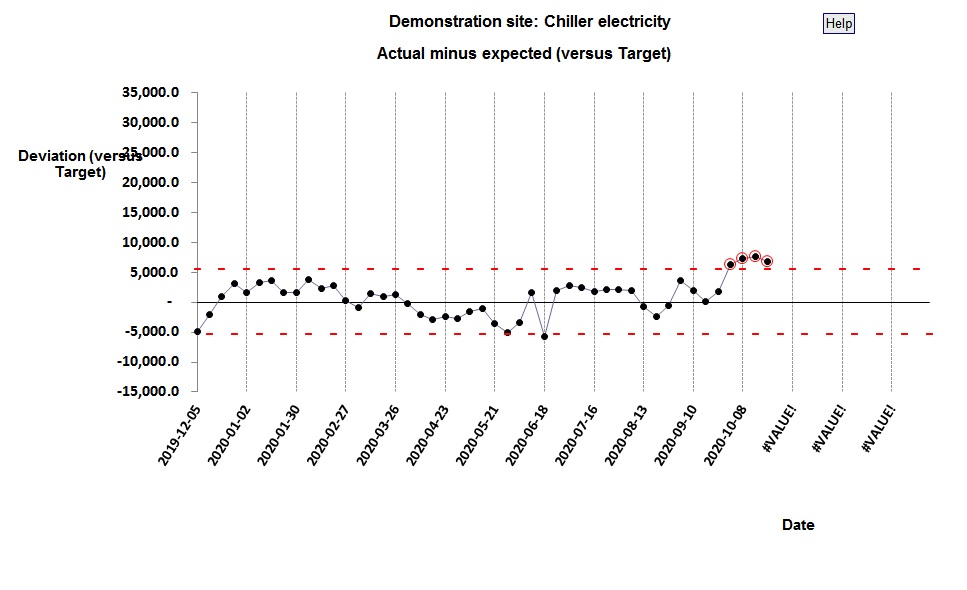
The problem was ultimately rectified by relocating the sensor used for reporting, and reverting to the correct space temperature set point. Figure 4 shows how consumption then came back within its normal control limits: