These are the results of a ‘crowd experiment‘ measuring the lengths of two bits of string.
At the time of writing just over 100 people have responded (thanks if you were one of them). Because people were measuring screen images at different scales, their answers have been normalised to a value of 100mm using a calibration scale which they also measured. The average measurements were:
String A: 110.2mm
String B: 89.1mm
The difference between these averages is 22.1mm. Of course each individual response yielded its own difference, and the average of those was the same.
Because we had a hundred independent goes at the measurements we can estimate their uncertainty. Here is the distribution of ‘Before’ and ‘After’ measurements:
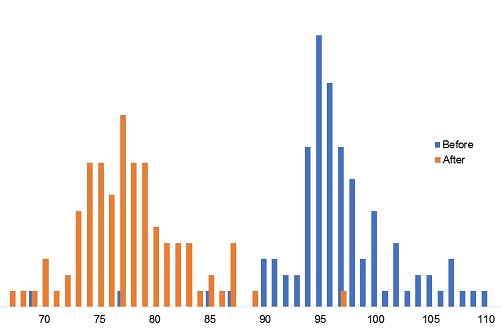
You can see that there was more spread in the ‘after’ measurements and the standard deviations of the measurements were:
Before: 7.0mm
After: 11.6mm
Theory suggests that the standard deviation of the measured differences would be the root of the sum of the squares, i.e,
√(7.02 + 11.62) = 13.5mm
Statistically, two-thirds of observations can be expected to fall within one standard deviation of the mean. So in this case, given that the mean difference was 22.1mm, all we can say is that there’s a 67% chance that the difference in length between the two strings was between 7.6 and 34.6 mm
Practical implications
How can we apply this thinking to the estimation of energy savings? Firstly we cannot have a hundred goes at the measurement, so we need another way to estimate the uncertainty in our measurements; and secondly we are rarely if ever looking at before-and-after consumptions that are constant.
Addressing the second objection first, we will normally have developed an expected-consumption formula which relates consumption to some independent driving factor (or factors). So we are not looking at deviations from a constant mean, but the deviations of actual measurements from the formula’s predictions (either before or after the energy-saving measure). We may not get a hundred shots at measuring the difference between ‘before’ and ‘after’, but with numerous attempts to predict expected consumption either side of the energy-saving measure we can get a good handle on the degree of uncertainty.